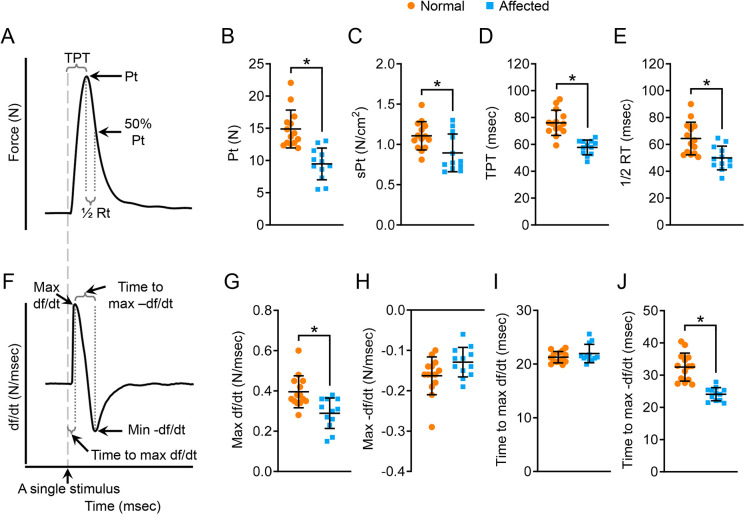
Fig. 3.
Characterization of the kinetic properties of twitch contraction. (A) An illustrative tracing of the force during twitch contraction. Electric stimulation is marked by a gray dashed line. 50% Pt, half absolute twitch force; ½ RT, half-relaxation time (time from Pt to 50% Pt). (B) Quantitative comparison of Pt. (C) Quantitative comparison of sPt. (D) Quantitative comparison of TPT. (E) Quantitative comparison of half-relaxation time. (F) An illustrative tracing of the velocity during twitch contraction. Max df/dt, maximum rate of force development during the contraction phase; max −df/dt, maximum rate of force reduction during the relaxation phase; time-to-max df/dt, time from the start of contraction to mdx df/dt; time-to-max −df/dt, time from Pt to mdx −df/dt. (G) Quantitative comparison of max df/dt. (H) Quantitative comparison of max −df/dt. (I) Quantitative comparison of time-to-max df/dt. (J) Quantitative comparison of time-to-max −df/dt. Sample size: normal (n=14) and affected (n=12). Data are mean±s.d. *P<0.05 (statistical analysis was performed using the unpaired Student’s t-test for B-E and G-J).

