Fig. 4.
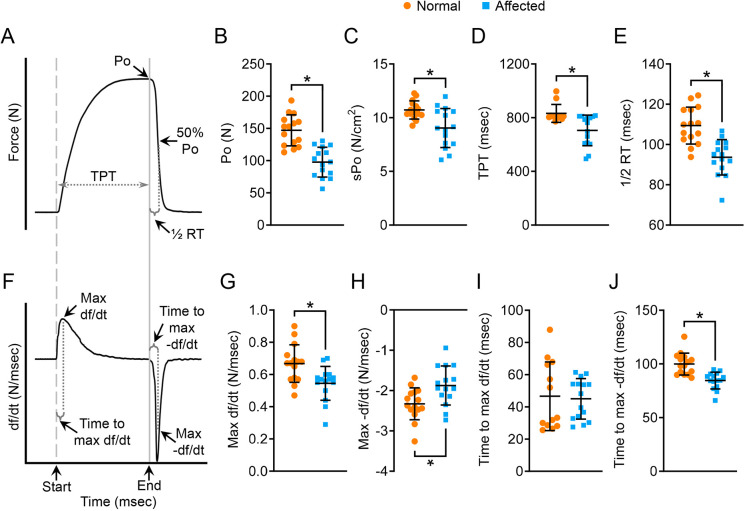
Characterization of the kinetics properties of tetanic contraction. (A) An illustrative tracing of the force during isometric tetanic contraction. The start and end of electric stimulation were marked by a gray dashed line and a solid gray line, respectively. 50% Po, half absolute tetanic force. (B) Quantitative comparison of Po. (C) Quantitative comparison of sPo. (D) Quantitative comparison of TPT. (E) Quantitative comparison of half-relaxation time. (F) An illustrative tracing of the velocity during isometric tetanic contraction. Max df/dt, maximum rate of force development during the contraction phase; max −df/dt, maximum rate of force reduction during the relaxation phase; time-to-max df/dt, time from the start of contraction to mdx df/dt; time-to-max −df/dt, time from the end of electric stimulation to mdx −df/dt. (G) Quantitative comparison of max df/dt. (H) Quantitative comparison of max −df/dt. (I) Quantitative comparison of time-to-max df/dt. (J) Quantitative comparison of time-to-max −df/dt. Sample size: normal (n=15) and affected (n=15). Data are mean±s.d. *P<0.05 (statistical analysis was performed using unpaired Student’s t-test for B-E and G-J).

