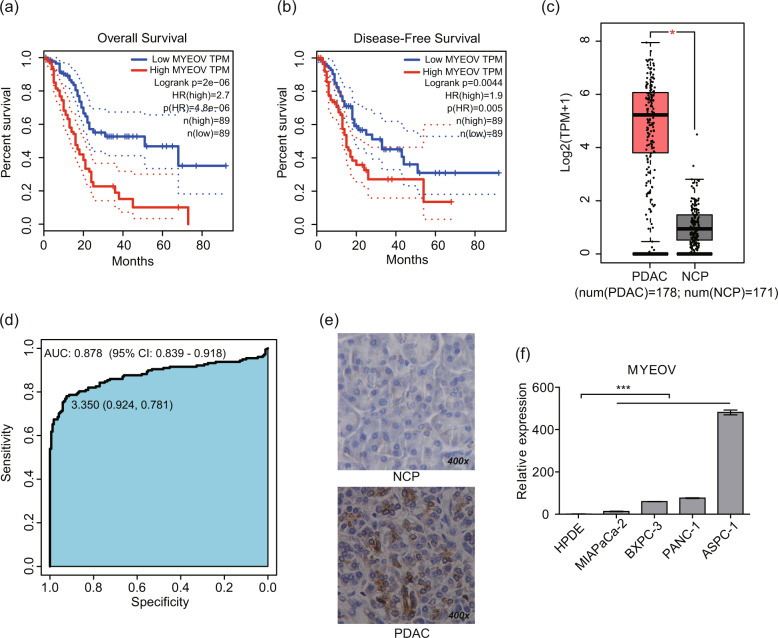
Fig. 1. MYEOV is correlated with the poor prognosis of PDAC patients and is highly expressed in PDAC cells.
a, b Kaplan–Meier curves of overall survival (a) and disease-free survival (b) of patients with PDAC based on MYEOV expression in the GEPIA database using the log-rank test. The dotted lines indicate the 95% confidence intervals for survival percentage at each time point as obtained by survival analysis. c MYEOV expression levels in PDAC (n = 178) and NCP tissues (n = 171) based on the expression levels in GEPIA database. Gene expression profiles of MYEOV from all available samples classified as PDAC tissue (n = 178) in TCGA and NCP tissue (n = 171) in TCGA and GTEx were chosen to perform differential analysis in GEPIA. The data are presented as the means ± SEM. *P < 0.05 (one-way ANOVA). d ROC curves based on the gene expression profiles of MYEOV in PDAC and normal tissue samples. The AUC value with a 95% CI is indicated. e Representative images of the IHC staining analyses of 19 FFPE PDAC and NCP tissues using an anti-MYEOV antibody (400× magnification). f Comparison of MYEOV expression levels in PDAC cell lines and normal pancreatic epithelial cells by qPCR. All n ≥ 3; bar, SEM; ***P < 0.001; Student’s t-test. ANOVA, analysis of variance; PDAC, Pancreatic ductal adenocarcinoma; NCP, non-cancerous pancreas; TPM, transcripts per kilobase million; ROC, receiver operating characteristic.

