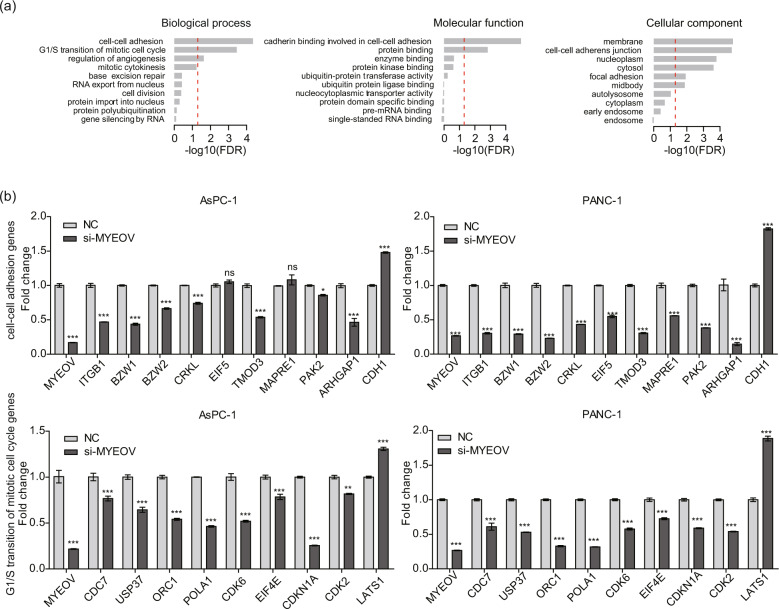
Fig. 4. Global effect of MYEOV depletion on the transcriptome in PDAC cells.
a GO enrichment analysis for differentially regulated mRNAs in MYEOV-depleted AsPC-1 and PANC-1 cells. The red dashed line indicates an FDR cut-off of value of 0.05. The y-axis represents specific GO items of three GO categories (biological process, molecular function and cellular component). The x-axis represents the enrichment magnitude of a specific GO item as measured by the FDR of Fisher’s exact test on a -log10 scale. b qPCR validation of selected genes during the cell-cell adhesion and G1/S transition of the mitotic cell cycle processes in PDAC cells. All n = 3; bar, SEM; *P < 0.05, **P < 0.01 and ***P < 0.001 compared with NC; Student’s t-test.

