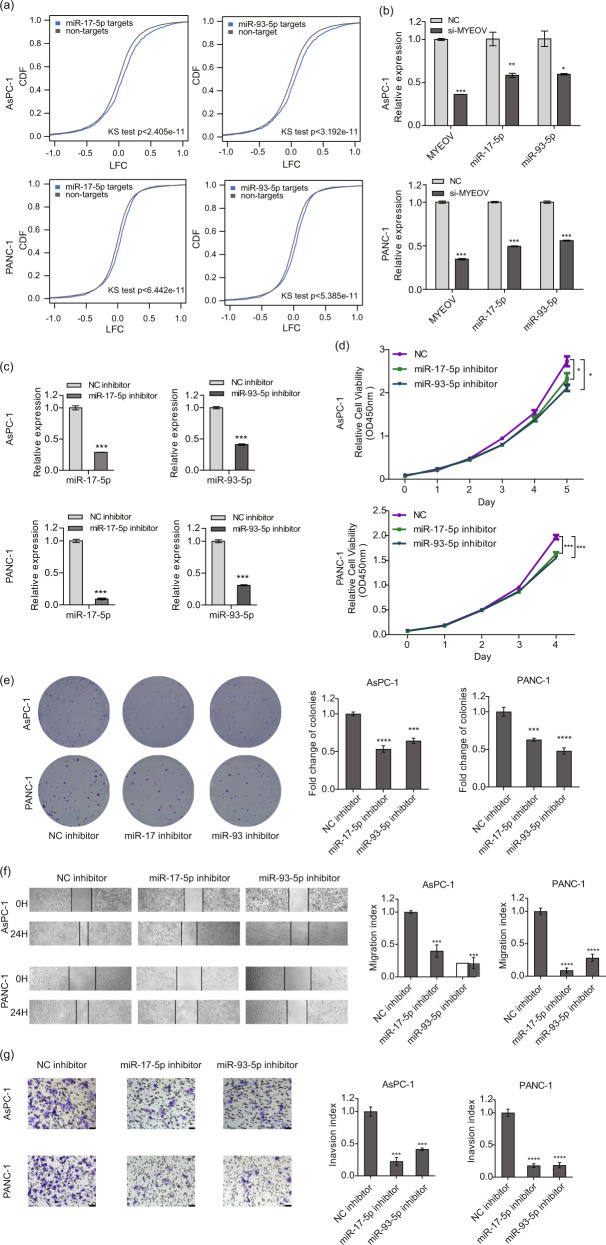
Fig. 5. Downregulation of miR-17-5p and miR-93-5p produces a similar effect as that observed with MYEOV depletion in PDAC cells.
a Changes in the expression of miR-17-5p and miR-93-5p target genes after MYEOV knockdown in two PDAC cell lines (AsPC-1 and PANC-1). The x-axis represents the LFC between MYEOV-knockdown and wild-type PDAC cells. The y-axis represents the cumulative distribution function (CDF) of LFC distribution. In each comparison, all expressed genes (excluding the target genes of cognate miRNAs) were used as the background. The cumulative distribution difference between targets and background genes was estimated using the Kolmogorov-Smirnov test. b The qPCR-based expression levels of miR-17-5p and miR-93-5p upon MYEOV knockdown. c The qPCR-based expression levels of miR-17-5p and miR-93-5p upon treatment with miRNA inhibitors. d, e Cell proliferation as measured by the CCK-8 (d) and colony formation (e) assays in AsPC-1 and PANC-1 cell lines transfected with the miR-17-5p inhibitor, miR-93-5p inhibitor or NC. f, g Cell migration (f) and invasion (g) as determined by scratch assay (40× magnification) and transwell invasion assay (200× magnification), respectively. All n = 3; bar, SEM; *P < 0.05, **P < 0.01 and ***P < 0.001 compared with NC; Student’s t-test.

