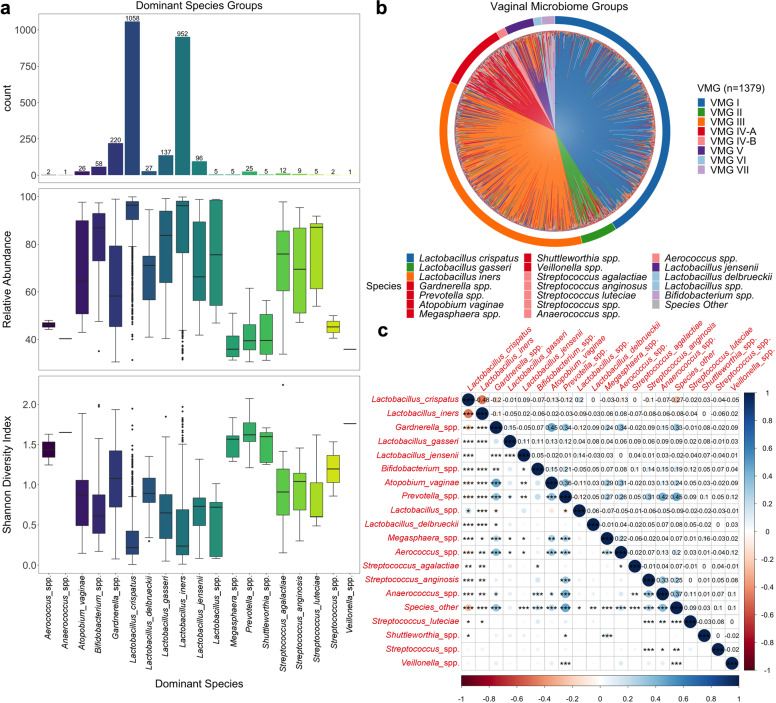
Fig. 1. Vaginal microbiome composition and structure.
a Bar chart displaying number of samples within each dominant species group. Box plots show relative abundance of species and Shannon diversity index of each dominant species group with bounds of the box representing the first and third quartiles, the center line representing the median and whiskers as min-to-max values. b Microbiome profiles of women with outcome data classified by vaginal microbiome groups (VMG). Color of species denotes the VMG group classification with VMG I (L. crispatus dominated, blue), II (L. gasseri dominated, green), III (L. iners dominated, orange), IV-A (bacterial vaginosis associated, red), IV-B (non-BV taxa, pink), V (L. jensenii dominated, purple), VI (Other Lactobacillus, light blue), and VII (Bifidobacterium dominated, light purple). c Correlation plot for dominant species showing correlation strength (circles), relationship (positive, blue; negative, red) and significance (***, p < 0.001; **, p < 0.01; *, p < 0.05).

