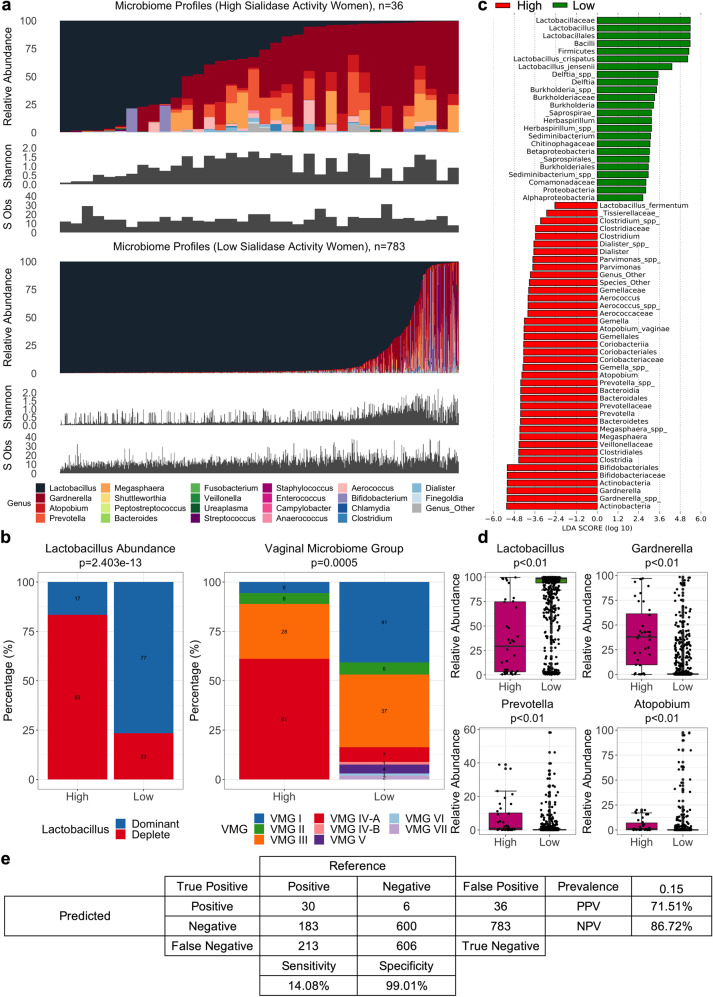
Fig. 2. Comparison between women in sialidase sub-cohort.
a Microbiome composition, diversity (Shannon Index) and richness (species observed) for all women with high (n = 36) and low (n = 783) sialidase activity. b Proportion of Lactobacillus abundance groups (Lactobacillus dominant and Lactobacillus deplete) and vaginal microbiome groups (VMG) for women with high or low sialidase activity. Statistical significance based on Fisher’s Exact Test. c LDA showing effect size of differentially abundant taxa associated with microbiota of women with high (red) or low (green) sialidase activity. d Comparison of relative abundance between main BV-associated bacteria identified as significantly different (Mann-Whitney Test, p < 0.05) between women with high and low sialidase activity (see Supplementary Table 3). The bounds of the box represent the first and third quartiles, center line represents the median, and whiskers show min-to-max values. e Confusion matrix with Lactobacillus abundance (dominant as positive/deplete as negative) as the reference test and sialidase result (High/Low) as the predicted test. The sensitivity, specificity, positive predictive value (PPV), and negative predictive value (NPV) were calculated.

