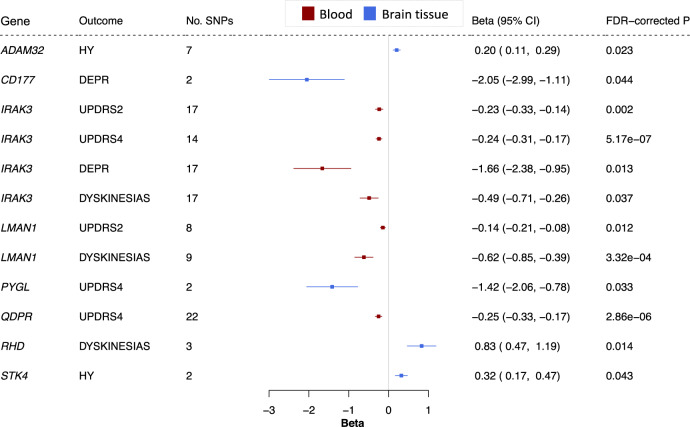
Fig. 4. Genetically-predicted expression of eight genes in blood or brain tissue is associated with PD progression markers.
Forest plot; the centre of the error bars show the standard-deviation change in each progression marker, per 1-standard-deviation increase in gene expression, calculated using the Wald ratio (if 1 SNP) or IVW (if >1 SNP). Results are colour-coded by tissue (red = blood, blue = brain tissue) and corrected for the number of genes tested. 95% CI 95% confidence interval, DEPR depression, FDR false discovery rate, HY Hoehn and Yahr, DEPR depression, UPDRS2-4 Unified Parkinson’s Disease Rating Scale parts 2 to 4.

