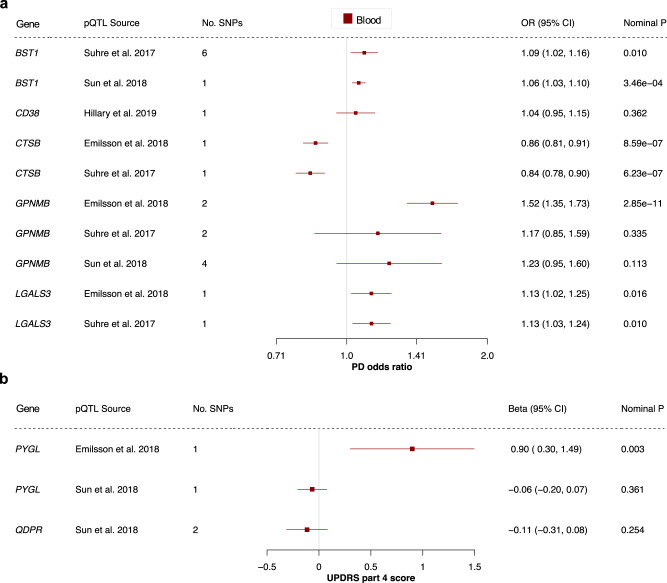
Fig. 5. Protein quantitative trait loci in blood provide further genetic evidence.
Forest plots showing the results for all proteins and outcomes where a pQTL was available. The centre of the error bars show the (a) PD odds ratio and (b) standard-deviation change in UPDRS part 4 score, per 1-standard-deviation increase in circulating protein levels, calculated using the Wald ratio (if 1 SNP) or IVW (if >1 SNP). The “pQTL Source” column indicates which pQTL study the SNPs were derived from. 95% CI 95% confidence interval, OR odds ratio, PD Parkinson’s disease, pQTL protein quantitative trait locus, UPDRS Unified Parkinson’s Disease Rating Scale.

