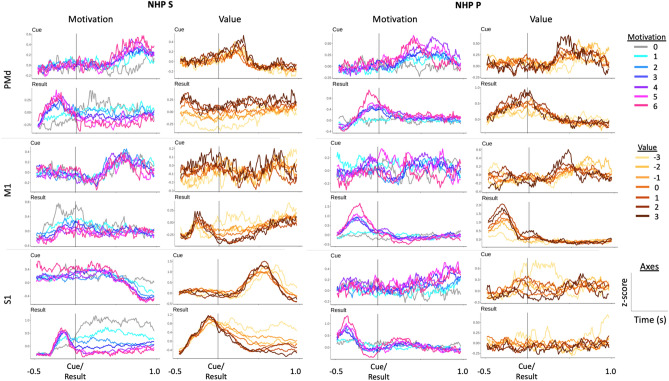
Figure 2.
Shows the peri-cue and peri-feedback time histograms for several example single units from each of the brain regions recorded from both NHPs. These units were chosen qualitatively. Each cue and result pair in a column are from an individual and distinct unit. Here we show units that qualitatively represent either valence-like or motivational-intensity-like response patterns. Units were binned and z-score normalized throughout a session. This normalized firing rate was then averaged for each valence level, defined as the reward level minus the punishment level for a given trial, or each motivational intensity level, defined as the reward level plus the punishment level for a given trial. Individual units demonstrated a range of responses following cue presentation and before and after feedback.

