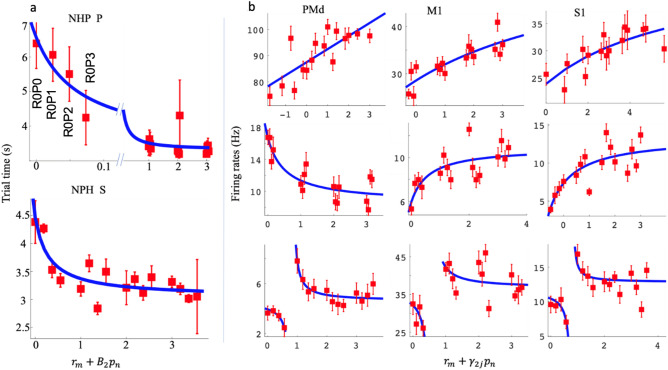
Figure 3.
Post-cue reward (R) and punishment (P) analysis with divisive normalization model 2. (a) depicts the average and SEM of the trial time (red) for different affective stimuli. The x-axis represents the R and P level in the form of an affective stimulus and the y-axis represents the trial time (s). We have labeled the R and P levels for the R = 0 group. (b) shows example unit R and P modulation for post-cue neural spike data. Each unit has an R and P encoding model 2 significantly different from a constant model (F-test, p < 0.05). For each subplot, the x-axis represents the affective stimulus as above, and the y-axis represents the post-cue firing rate (Hz). Each red point represents the mean post-cue firing rate (0–500 ms post cue onset) for that R and P level ± the SEM, and the blue line represents model 2 fit to that unit’s data. The first column includes units from PMd, the second column M1, and the third column S1. The rows from top to bottom show examples of linear, sigmoidal, and hyperbolic units.

