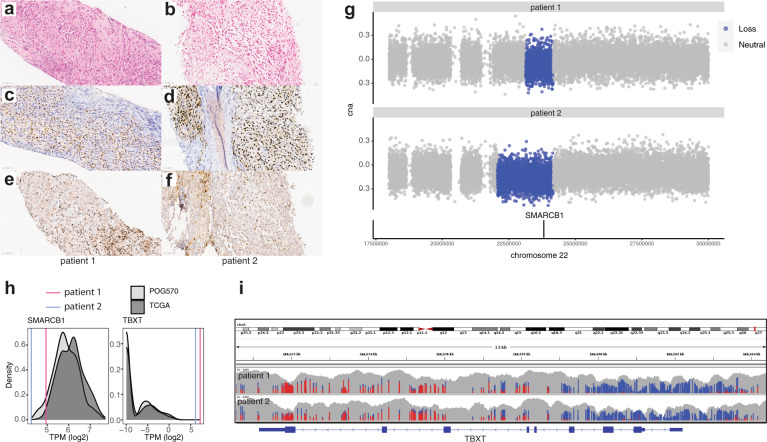
Fig. 1. SMARCB1/INI1 loss and TBXT/brachyury expression in paediatric chordoma.
Formalin-fixed paraffin-embedded (FFPE) sections of the biopsies from patient 1 (a, c, e) and patient 2 (b, d, f) display features consistent with a poorly differentiated chordoma (PDC) in these two patients. H&E photomicrographs (a, b) are composed of sheets of epithelioid to spindle cells associated with occasional eosinophilic cytoplasm and vesicular nuclei admixed with fibroblasts and inflammatory cells. Tumour cells strongly expressed nuclear brachyury (c, d) and are negative for nuclear expression of INI1 (e, f). Inflammatory cells retain nuclear expression of INI1 and are negative for brachyury expression. Original magnification: ×400, scale bars represent 60 μm. g Tumour/normal ratios of binned read depths and copy states for chromosome 22 (hg19 chr22:18000000–30000000) for patients 1 (top) and 2 (bottom). Regions defined as single copy loss are denoted in blue. The SMARCB1 gene location is indicated by the black bar on the lower track. h Comparison of SMARCB1 and TBXT gene expression in paediatric PDC to the TCGA sarcoma data set18 (dark grey, n = 261) and POG570 pan-cancer cohort (light grey, n = 570). Log2-transformed TPM is plotted on the x-axis and sample densities on the y-axis. The gene expression of SMARCB1 and TBXT in paediatric chordomas is represented by vertical lines (patient 1; 4.94 and 7.2 log2(TPM) and patient 2; 4.26 and 6.1 log2(TPM), respectively). Median SMARCB1 expression was 5.82 and 6.13 log2(TPM) for the POG570 and TCGA sarcoma cohorts, respectively. Median TBXT expression was −9.97 log2(TPM) for both POG570 and TCGA sarcoma cohorts. i DNA methylation profiles of the TBXT gene. Unmethylated (blue) and methylated (red) CpGs are shown for patients 1 and 2. The grey bars represent overall read depth (data range 0–100, log scale).

