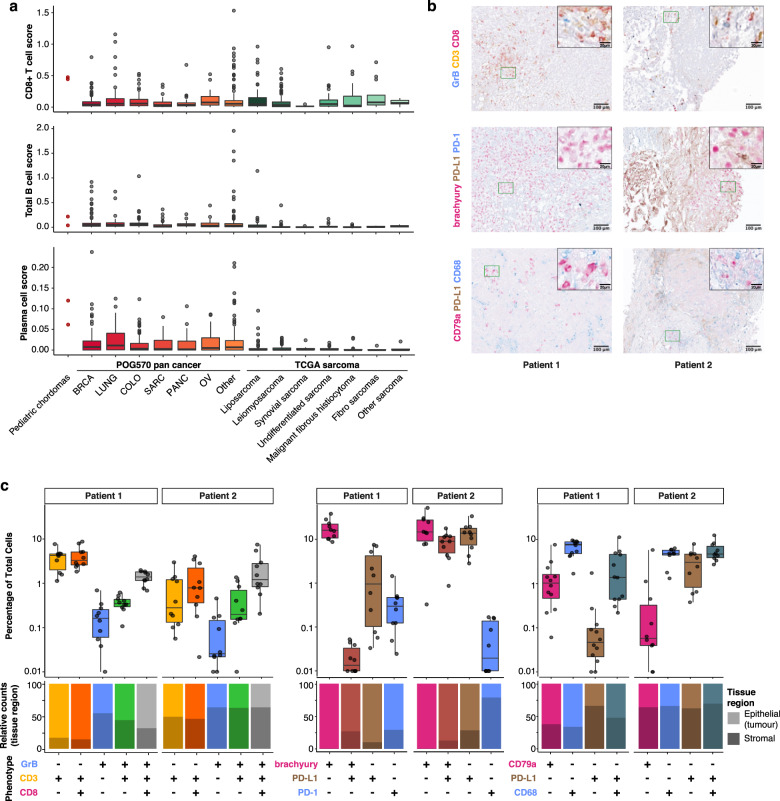
Fig. 2. Immune microenvironment of poorly differentiated chordomas.
a CIBERSORT estimation of CD8+ T cell, B cell and plasma cell abundance from bulk paediatric chordoma RNA sequencing data in paediatric chordomas, POG570 adult cancers19 and the TCGA sarcoma data set18. CD8+ T cell score (top panel) for patient 1 was 0.44 and for patient 2, 0.48 compared to the other cancer types, i.e. POG570 pan cancer adult solid tumours median score = 0.05 (BRCA, n = 144; LUNG, n = 67; COLO, n = 87; SARC, n = 47; PANC, n = 42; OV, n = 28; other, n = 155), TCGA sarcoma median score = 0.04 (n = 255). Similarly, B cell scores (middle panel) for patient 1 = 0.04, patient 2 = 0.22, POG570 median score = 0.04, TCGA sarcoma median score = 0.01. Plasma cell scores (bottom panel) for patient 1 = 0.06, patient 2 = 0.12, POG570 median score = 0.01, TCGA sarcoma median score = 0.00. b Example ×20 images of multiplex IHC staining with granzyme B (GrB)/CD3/CD8, brachyury/PD-L1/PD-1 and CD79a/PD-L1/CD68 panels. c Percentage of cells stained with the respective antibodies from paediatric chordoma patients 1 and 2. Individual points represent the respective cellular fraction for each population measured from independent images (n ≥ 10) taken from different locations of the slide for each patient sample. The relative proportion of either epithelium- or stroma-associated cells for each cellular population is displayed in the bottom panel. Box plots in a, c represent median, upper and lower quartiles, and whiskers represent limits of the distributions (1.5-times interquartile range).

