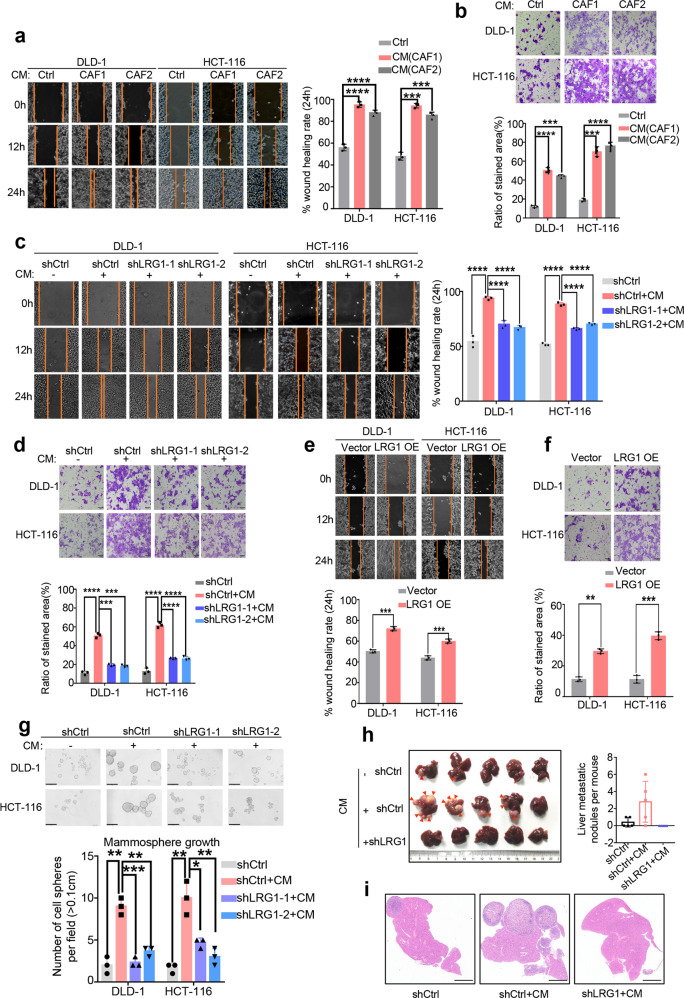
Fig. 2. Cancer-associated fibroblasts promote cell migration and invasion in a LRG1-dependent way.
a Migratory ability of DLD-1 and HCT-116 upon co-culture with CM from CAFs or not was assessed by scratch wound healing assay. Left: Representative images of CM-treated DLD-1 and HCT-116 taken at the indicated time intervals. Right: Plot showing wound healing rate of DLD-1 and HCT-116 upon co-culture with CM from CAFs or not at 24 h. b Invasive capability of DLD-1 and HCT-116 with or without CM treatment was assessed by Boyden chamber trans-well assay. Up: Representative images of CM-treated DLD-1 and HCT-116 taken at the indicated time intervals (Scale bar, 50 μm). Down: Plot showing the percentage of invasive cells area upon co-culture with CM or not at 24 h. c Migratory capability of DLD1 and HCT-116 induced by CM in presence or absence of LRG1 was assessed by scratch wound healing assay. Hereafter, CM represents conditioned medium from CAF1 unless stated otherwise. Left: Representative images of CM-treated DLD-1 and HCT-116 with or without silencing of LRG1. Right: Plot showing statistical analysis of wound healing rate at 24 h. d Invasive capability of DLD1 and HCT-116 induced by CM in the presence or absence of LRG1 was assessed by Boyden chamber assay. Up: Representative images of CM-treated DLD-1 and HCT-116 with or without silencing of LRG1 (Scale bar, 50 μm). Down: Plot showing statistical analysis of the percentage of invasive cells area at 24 h. e Migrative ability of DLD-1 and HCT-116 with ectopic expression of LRG1 or not was analyzed by scratch wound healing assay. Up: Representative images of DLD-1 and HCT-116 with or without ectopic expression of LRG1. Down: Plot showing rate of wound healing in DLD1 and HCT-116 with or without LRG1 overexpression at 24 h. f Invasive capability of DLD-1 and HCT-116 with ectopic expression of LRG1 was assessed by Boyden chamber assay. Up: Representative images showing invaded DLD-1 and HCT-116 cells (Scale bar, 50 μm). Down: Graphs showing statistical analysis of the percentage of invasive cells area at 24 h. g Tumorsphere growth of DLD1 and HCT-116 induced by CM in the presence or absence of LRG1 was assessed by tumorsphere formation assay after 7 days culture. Up: Representative images showing spheroids of DLD-1 and HCT-116 cells (Scale bar, 50 μm). Down: Graphs showing statistical analysis of the number of spheroids with diameter >0.1 cm. h Left: Images showing the liver metastasis of DLD-1 cells which expressed indicated shRNAs and were cultured with control medium or conditioned medium from CAFs before transsplenic injection into nude mice. (The red arrows indicate metastatic nodules). Right: Plot showing the liver metastatic nodules per mouse in three groups. i Representative images showing H&E staining of liver tissue samples from the three groups as indicated in h (Scale bar, 50μm). Error bars represent SD; n = 3. **p < 0.01, ***p < 0.001, ****p < 0.0001.

