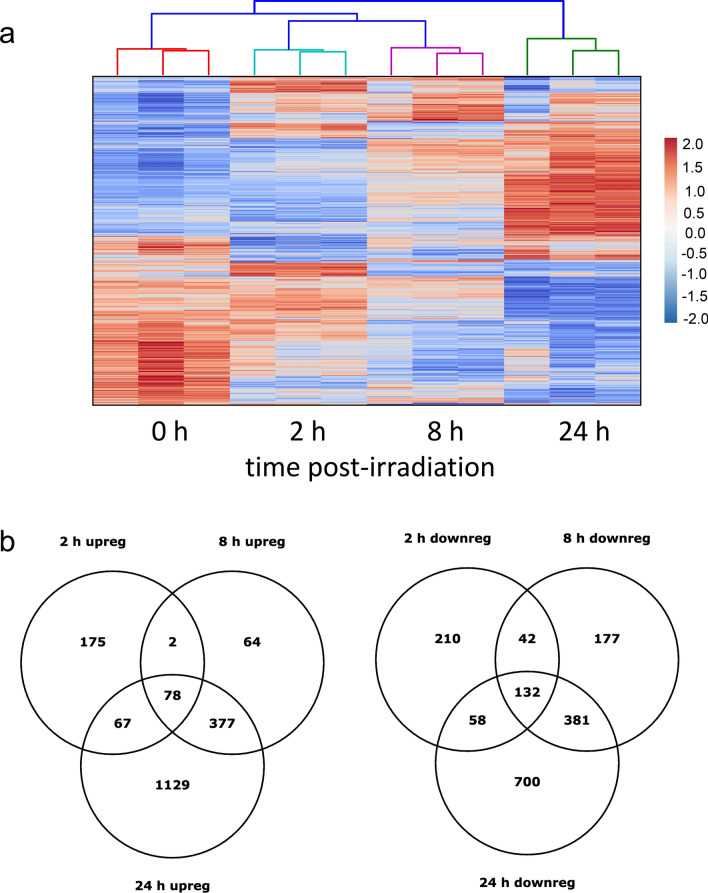
Figure 4.
Clustering and distribution of differentially expressed genes (DEG). HLMVEC were grown to 70% confluence and exposed to 10 Gy X-ray irradiation. RNA was prepared at 2, 4, 6, 8 and 24 h post-irradiation and used for RNA-seq. (a) Heat map indicates distinct gene expression patterns at each time point post-irradiation. Controls are non-irradiated samples. Included are genes differentially regulated over the 24 h time course, q < 0.05. (b) Venn diagrams illustrate overlap of the number of DEG expressed at each time point for upregulated or downregulated genes, q < 0.05, fold change > 1.5. Data was generated using RNA from three independent experiments.

