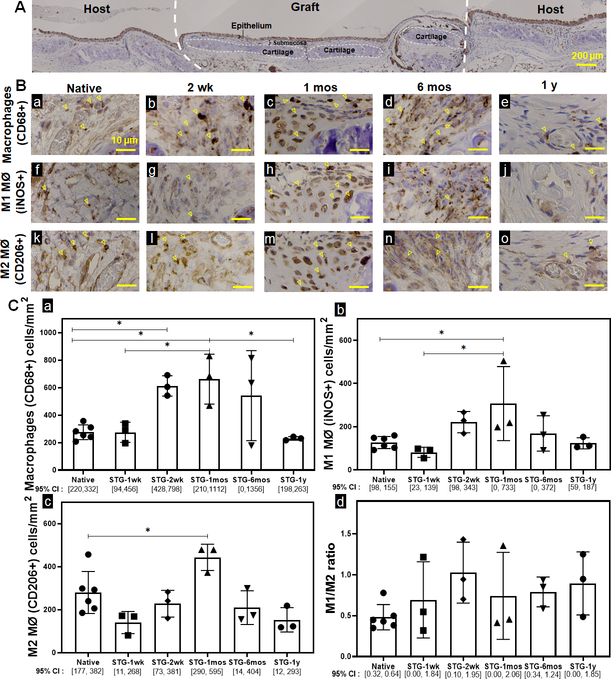
Figure 1. Macrophage quantification and phenotype of native and syngeneic tracheal grafts.
A. Representative IHC image of an orthotopically implanted syngeneic tracheal graft (STG) and adjacent host trachea. B. Immunohistochemistry against CD68 (a~e), iNOS (f~j), and CD206 (k~o) cells in native control and STG at post-op 1wk, 2wk, 1 mos, 6 mos and 1 y were performed on serial sections to characterize macrophages, M1 macrophages and M2 macrophages, respectively. Representative positive staining of macrophages is highlighted by arrowheads. Scale bar=10 μm. C. Data was represented as CD68+ (a), iNOS+ (b), CD206+ (c) macrophages per mm2 of the graft and the ratio of macrophage phenotype M1 (iNOS+)/ M2 (CD206+) (d) in the graft. (n=3; ANOVA with Tukey’s test; * p<0.05; Error bars represents the standard deviation)

