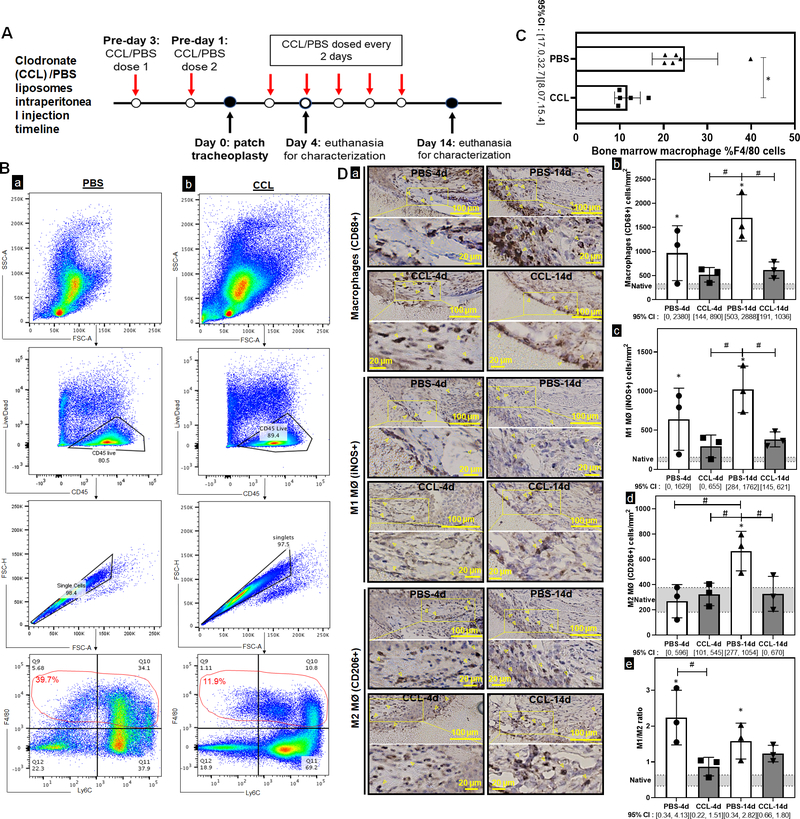
Figure 4. Macrophage depletion in synthetic tracheal graft implantation.
A. Intraperitoneal clodronate (CCL) or PBS liposomes were administered every other day, with the surgery occurring 3 days after the first dose to ensure depletion at time of implant. B. Flow cytometric analysis was used to characterize bone marrow macrophages in the PBS and CCL injected mice. Gating strategy for macrophages was defined as Live CD45+/F480+ cells. C. Quantification of macrophage population in bone marrow of PBS and CCL injected mice. (n=6; Welch’s t-test; * = p<0.05; Error bars represents the standard deviation) D. Immunohistochemistry against macrophages (CD68+), M1 macrophages (MØ) (iNOS+), and M2 MØ (CD206+) cells (a) were performed to indicate macrophage infiltrates in the submucosa over macrophage depleted and control mice at days 4 and 14 post-implant. Positive staining of macrophages is highlighted by the arrowheads. Scale bar=100 μm. Data was represented as macrophages (CD68+) (b), M1 MØ (iNOS+) (c), M2 MØ (CD206+) (d) macrophages per mm2 of the graft and the ratio of macrophage phenotype M1 (iNOS+)/ M2 (CD206+) (e) between PBS and CCL mice at 4d and 14d. Macrophage counts in native phenotypes are indicated by the grey bars. Error bars represents the standard deviation. (n=3; ANOVA with Tukey’s test; * p<0.05 compared to native; # p<0.05 between PBS and CCL; Error bars represent standard deviation)

