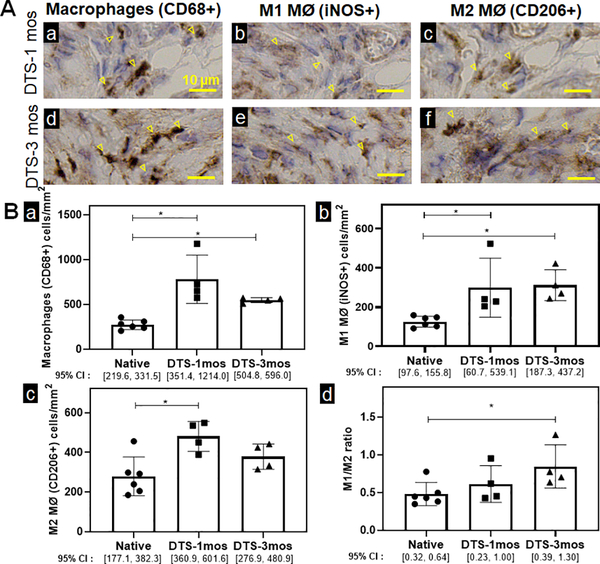
Figure 6. Macrophage quantification and characterization of decellularized tracheal scaffolds.
A. Immunohistochemistry against macrophages (CD68+) (a), M1 macrophages (MØ) iNOS+ (b), and M2 MØ (CD206+) (c) cells were performed to indicate macrophage infiltrates in decellularized graft at 1 month and 3 months. Positive staining of macrophages is highlighted by the arrowheads. Scale bar=10 μm. B. Data was represented as macrophages (CD68+) (a), M1 macrophages (MØ) (iNOS+) (b), M2 MØ (CD206+) (c) macrophages per mm2 of the graft and the ratio of macrophage phenotype M1 (iNOS+)/ M2 (CD206+) (d) of DTS mice at 1 month and 3 months. (n=4; ANOVA with Tukey’s test; * p<0.05; Error bars represent standard deviation)

