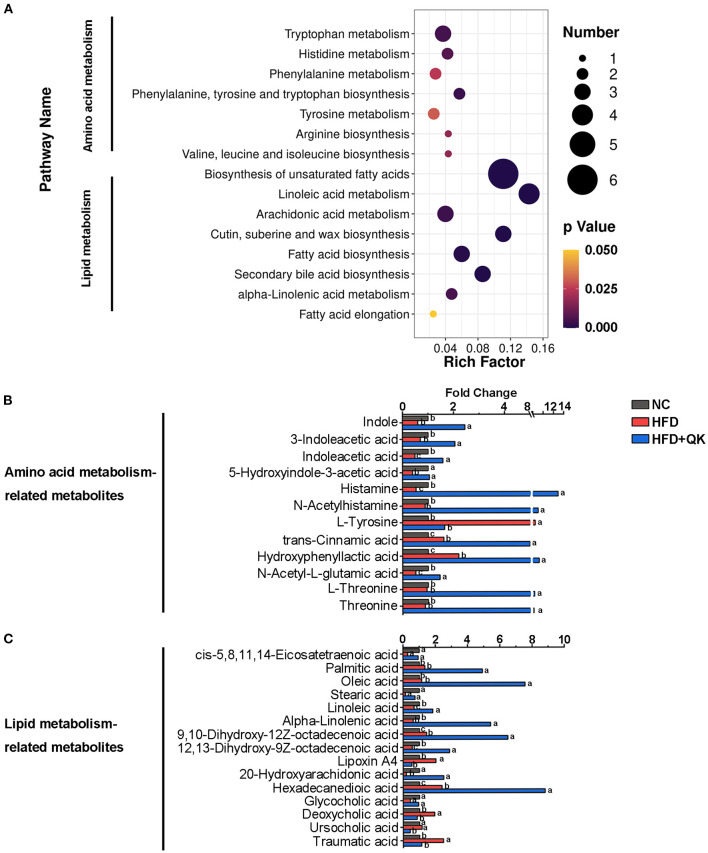
Figure 6.
Effects of WGQK on fecal metabolites. (A) KEGG Enrichment Scatter Plot of Amino acid metabolism and lipid metabolism. Rich Factor= S_metabolites_Number/B_metabolites_Number, the size of the bubble indicates the amount of significantly differential metabolites which are enriched in this pathway, and the point with different gradation of color represents the scope of p-value. The higher value of rich factor stands for the higher degree of enrichment, and the lower p-value represents the more significant degree of enrichment; (B,C) The fold change of metabolite abundance involved in (B) amino acid metabolism, and (C) lipid metabolism.

