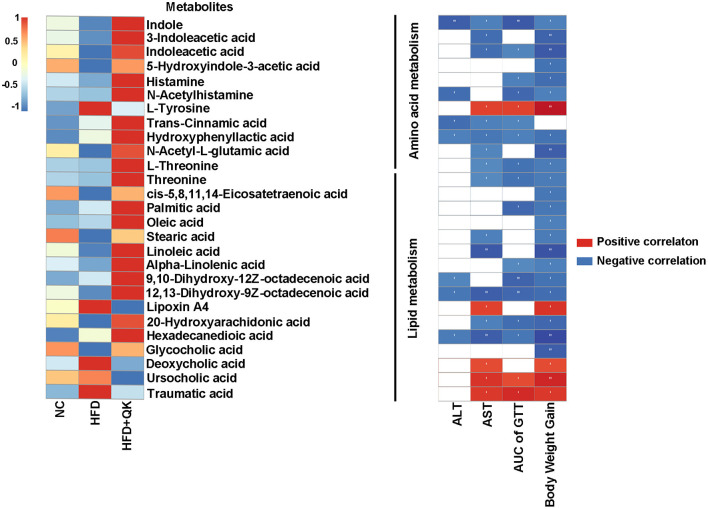
Figure 7.
Correlation between metabolites and host parameters related to glucose and lipid metabolism. Left, heat map of metabolites involved in amino acid and lipid metabolism. Right, Spearman correlations between the abundance of these metabolites and the host parameters related to obesity. Red indicates positive correlation and black indicates negative correlation, the darker the color, the stronger the correlation, *p < 0.05, **p < 0.01.

