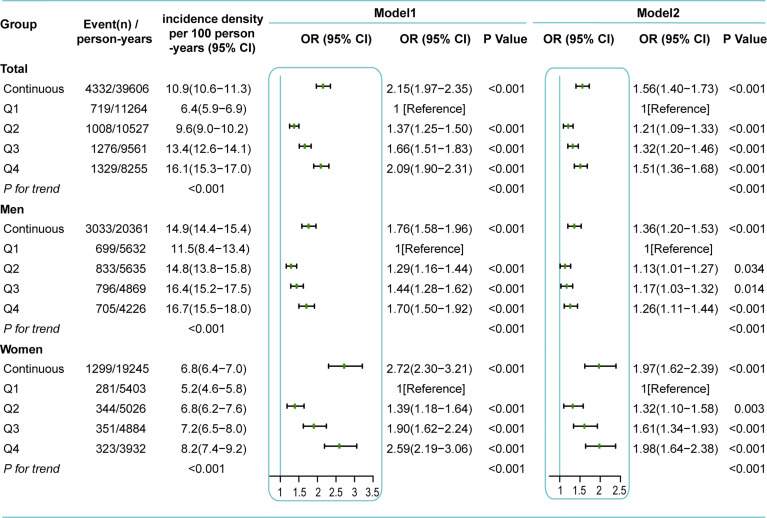
Figure 4.
Incidence density and GEE analysis for incident NAFLD based on RBC count during follow-up. Q1, the lowest quartile of RBC count (<4.83×10¹²cells/L for men, <4.33×10¹²cells/L for women); Q2, the second quartile of RBC count (4.83-5.08×10¹²cells/L for men, 4.33-4.52×10¹²cells/L for women); Q3, the third quartile of RBC count (5.09-5.32×10¹²cells/L for men, 4.53-4.74×10¹²cells/L for women); Q4, the highest quartile of RBC count (>5.32×10¹²cells/L for men, >4.74×10¹²cells/L for women). Model 1 was adjusted for age, follow-up time. Model 2 was adjusted for age, BMI, SBP, GLU, TG, HDL-C, LDL-C, diet, smoking, exercise, follow-up time, and residual errors of regressing Hb on RBC. Sex was also adjusted in all models of the total group.

