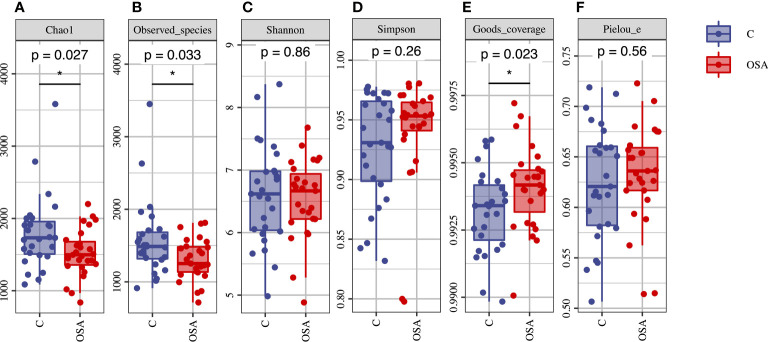
Figure 2.
Alpha diversity analysis of the salivary microbial samples. (A) Chao1 Index; (B) Observed species; (C) Shannon Index; (D) Simpson Index; (E) Goods coverage; (F) Pielou’s evenness. The Chao1 and observed species were significantly decreased in the OSA group. Goods coverage were significantly higher in the OSA group. There was no significant difference of Shannon, Simpson and Pielou’s evenness between the two groups. *p < 0.05 was considered statistically significant.

