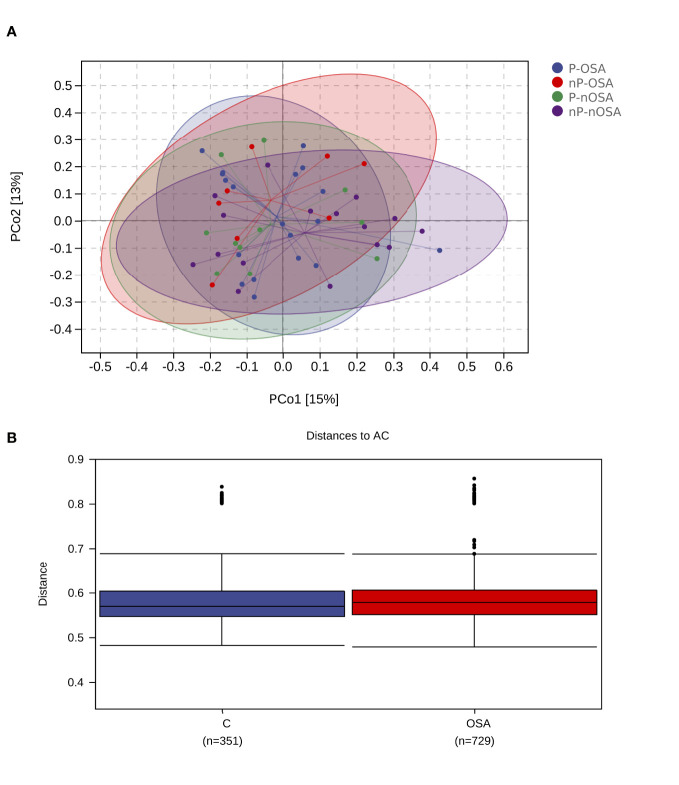
Figure 3.
Beta diversity analysis of the salivary microbial samples. (A) Principal Coordinates Analysis (PCoA) calculated by the relative abundance of OTUs. Salivary microbial samples were divided into four categories. OSA-P, OSA/periodontitis; OSA-nP, OSA/non-periodontitis; nOSA-P, non-OSA/periodontitis; nOSA-nP, non-OSA/non-periodontitis. The communities of the four categories had the tendency to cluster apart from each other. (B) The average weighted UniFrac distance value of the OSA group is slightly higher than the non-OSA group.

