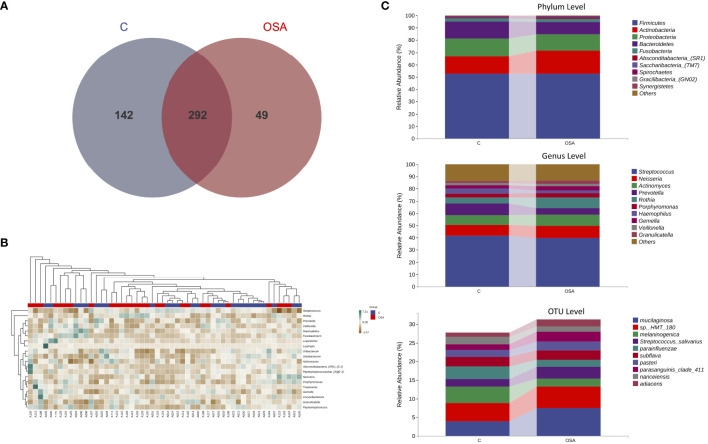
Figure 4.
Analysis of the composition and structure of microbial communities at the genus level. (A) Venn diagram to visualize the shared and unique OTUs in the OSA and the non-OSA group. (B) Heatmap of the relative abundance of salivary microbiome at the genus level of each participant. (C) The relative abundance and distribution displaying the top-most significantly different taxa at phylum, genus, and OTU levels between the OSA and the non-OSA group.

