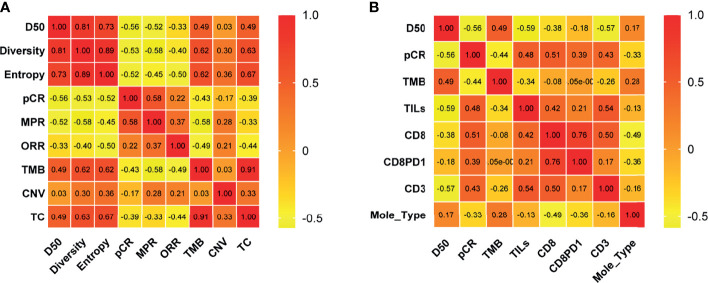
Figure 2.
Correlation of molecular and clinical response variables. Correlation coefficients between two variables among TCR D50, Diversity index, Entropy, pCR, MPR, ORR, TMB, CNV, and T cell percentages in tissues of pre-NAC samples (A) and among D50, pCR, TMB, TILs, CD8, CD8PD1, CD3 and molecular types (B) were listed. The number in the color chart is the correlation coefficient. pCR, pathologic complete response; MPR, major pathological response; ORR, Objective Response Rate; TMB, tumor mutational burden; CNV, Copy number variations; TC, TMB and CNV; Mole_Type, Molecular typing.

