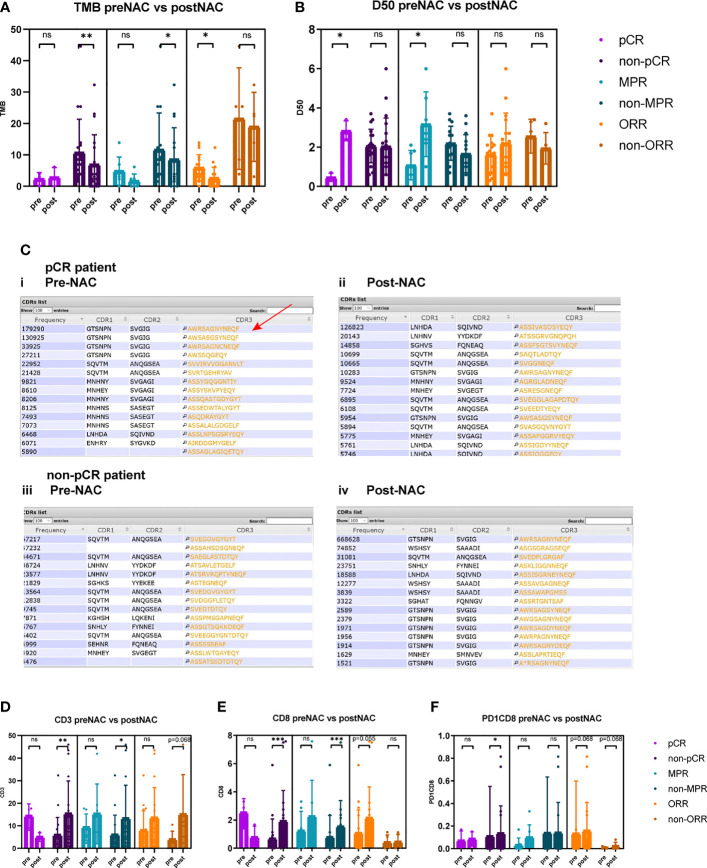
Figure 3.
Comparison of TMB, TCR D50, CD3+, CD8+, and PD1+CD8+ cells between pre-NAC and post-NAC tumor tissues. (A) TMB reduced significantly after neoadjuvant therapy in non-pCR patients (10.6 vs. 6.8, p = 0.010), in non-MPR patients (12.3 vs. 8.5, p = 0.041), and in ORR patients (6.0 vs. 2.6, p = 0.017). TMB was not significantly different between pre-NAC and post-NAC tumors or non-cancerous residual tissues in pCR patients (2.3 vs. 2.8, p = 0.879), in MPR patients (3.4 vs. 1.6, p = 0.176), and in non-ORR patients (21.5 vs. 18.9, p = 0.500). (B) TCR D50 index significantly increased post-NAC versus pre-NAC in pCR patients (0.467 vs. 2.883, p = 0.028) and in MPR patients (1.086 vs. 3.171, p = 0.028), but not significantly change after NAC in non-pCR patients (D50 2.066 vs. 2.037, p = 0.658), and in non-MPR patients (2.203 vs. 1.667, p = 0.125), and in both ORR (1.638 vs. 2.206, p = 0.332) and non-ORR patients (2.560 vs. 1.940, p = 0.343). (C) Top 15 CDR3 motifs in pre-NAC tumors (i, iii) and post-NAC residual non-cancerous or cancerous tissues (ii, iv) of pCR and non-pCR patients. CDR3 motif is the major element recognizing the tumor specific mutated antigens. The CDR3 peptide AWRSAGNYNEQF is the highly expressed TCR in pre-NAC samples of pCR patients (Red arrow) and in post-NAC samples of non-pCR patients. (D) In non-pCR patients and non-MPR patients, the percentages of CD3+ T cells significantly increased after NAC (5.9% vs. 15.3%, p = 0.003; 5.9% vs. 13.2%, p = 0.019). (E) In non-pCR patients and non-MPR patients, the percentages of CD8+ T cells significantly increased after NAC (0.8% vs. 1.9%, p = 0.001; 0.1% vs. 1.5%, p = 0.001). (F) In non-pCR patients, the percentages of PD1+CD8+ T cells significantly increased after NAC (0.11% vs. 0.13%, p = 0.025). ns, not significant; *p < 0.05; **p < 0.01; ***p < 0.001.

