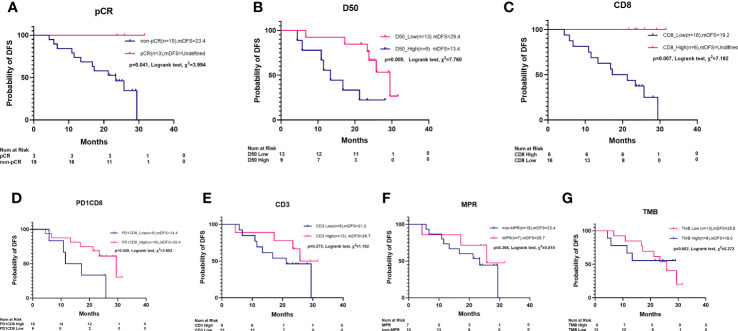
Figure 5.
Kaplan–Meier survival plot of disease-free survival by pCR, MPR, TCR D50, PD1+CD8+ cells, CD3+ cells, CD8+ cells, and TMB. (A) pCR patients had a longer median disease-free survival (mDFS) than non-pCR patients (NR vs. 23.4 m, Log rank test, χ 2 = 3.994, p = 0.041). (B) A longer mDFS was observed in patients with high TCR clonality than those with low TCR clonality (29.4 m vs. 13.4 m, Log rank test, χ 2 = 6.660, p = 0.009). (C) A longer mDFS was observed in patients with high-level CD8+ cells than those with low-level CD8+ cell (NR vs. 19.2 m, Log rank test, χ 2 = 7.182, p = 0.007). (D) A longer mDFS was observed in patients with high-level PD1+CD8+ cells than those with low level PD1+CD8+ cells (29.4 m vs. 14.4 m, Log rank test, χ 2 = 3.852, p = 0.049). (E) mDFS was numerically but not statistically longer in patients with high-level CD3+ cells than those with low-level CD3+ cells (28.7 m vs. 21.3 m, χ 2 = 1.192, p = 0.275). (F) Not statistically different mDFS was found between MPR patients and non-MPR patients (25.7 m vs. 23.4 m, Log rank test, χ 2 = 0.810, p = 0.368). (G) Not statistically different mDFS was found between high TMB and low TMB patients (25.8 m vs. 18.0 m, Log rank test, χ 2 = 0.272, p = 0.602).

