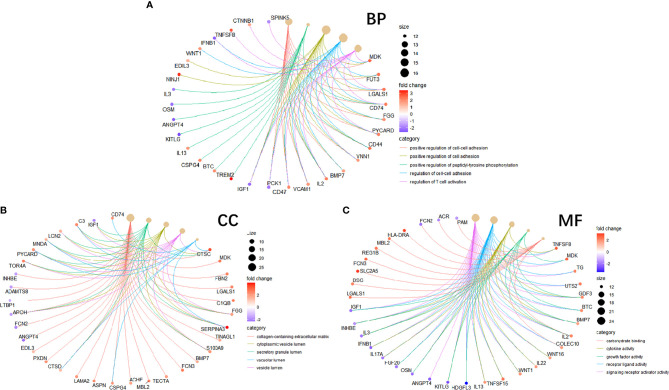
Figure 5.
Circle graph in GO enrichment of EP-DEGs. (A–C) The circle graph shows the EP-DEGs enriched in the Top5 GO categories of BPs, CCs, and MFs, respectively. The yellow points represent the GO categories, the color of the line delivered by a point indicates the category of the point in the legend, the size of a point indicates the number of the genes it includes.

