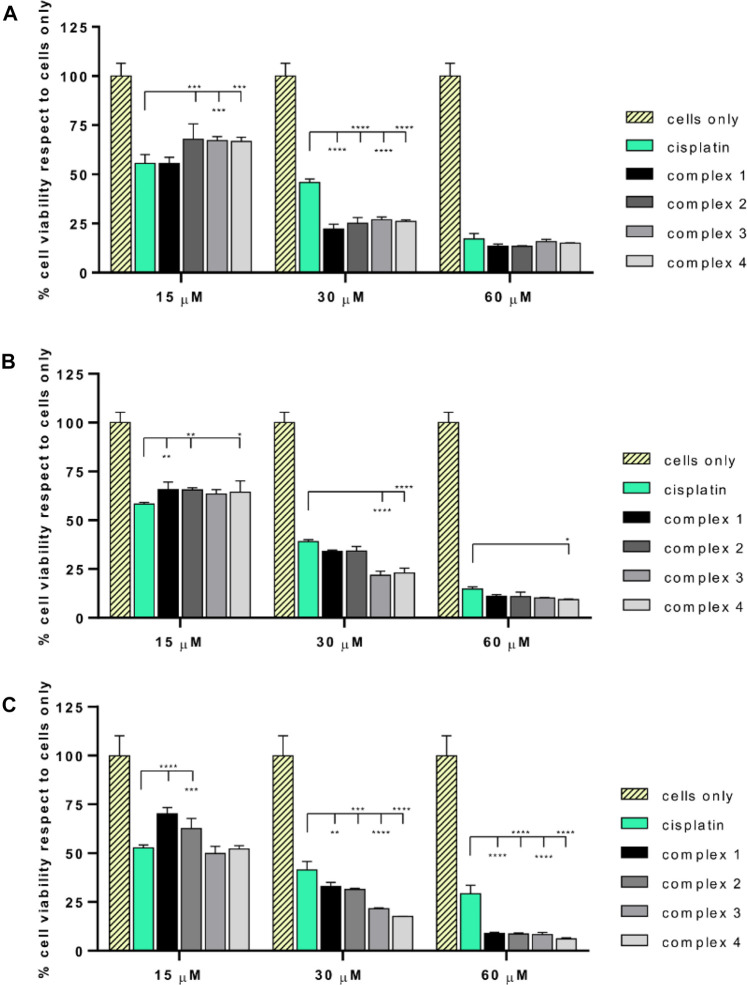
FIGURE 3.
MTT assay of SAOS-2, U-2 OS, and MG63. Percentage of cell viability (mean ± SEM) respect to cells only is reported in the graphs for SAOS-2 (A), U-2 OS (B) and MG63 (C) after 72 h of drug exposure. Statistically significant differences respect to cisplatin are reported in the graphs (*p value ≤ 0.05, **p value ≤ 0.01, ***p value ≤ 0.001, ****p value ≤ 0.0001).

