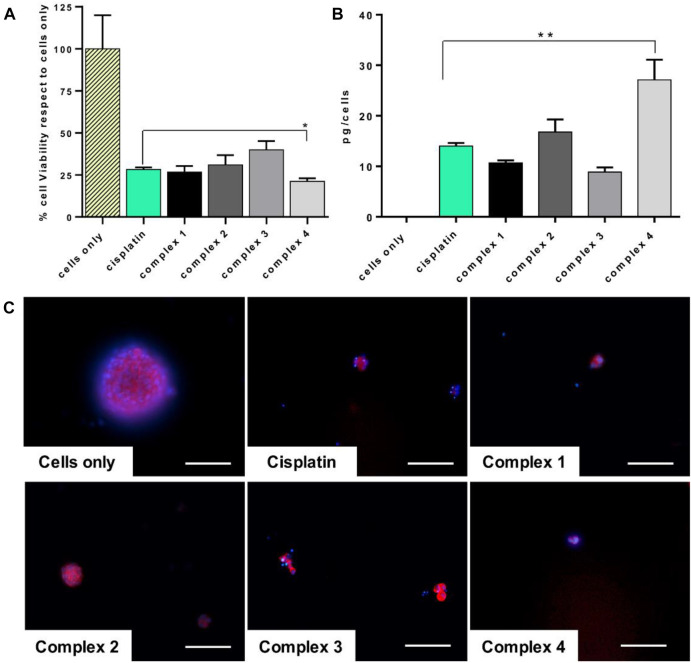
FIGURE 5.
Cisplatin and complexes 1–4 effect on CSCs. CSCs treated for 72 h with 30 µM of drugs. (A) MTT assay. Mean ± SEM of the percentage of cell viability respect to cells only (*p value ≤ 0.05). (B) ICP-OES analysis. Cellular uptake of picograms of platinum ions (mean ± SEM) per cell are expressed in the graph (**p value ≤ 0.01). (C) Actin and DAPI staining of CSCs. F-actin filaments in red; cell nuclei in blue. Scale bars 100 µm.

