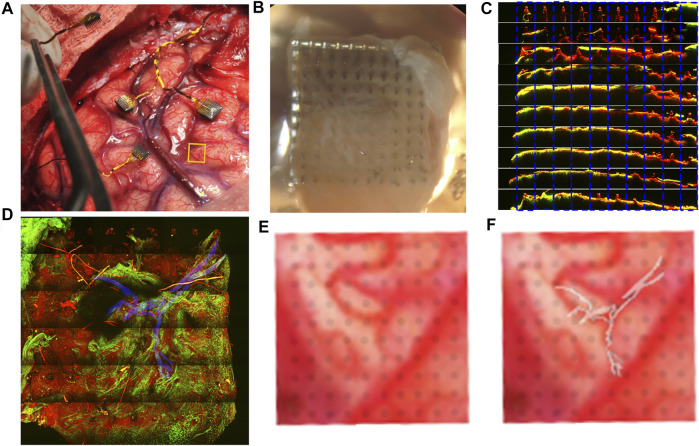
FIGURE 4.
Brain vascularization can be visualized on the medial Pt array from P2. The pre-implant location is indicated with a yellow box (A). (B) Optical image of the array showing tissue coverage. (C) TPM of the shanks of the electrode, with green denoting second harmonic signal from collagen and red denoting the autofluorescence of the device. Each electrode was imaged and separated by row (side view). Most of the electrode tips are covered by collagenous tissue. (D) TPM image of the array looking from the tips downward, with a portion of vasculature marked in blue as determined by SHG imaging. (E) zoomed in image from (A) where electrode shanks are superimposed on the underlying vasculature. (F) The vasculature visualized in (D) is superimposed on (E), showing similar trajectory, demonstrating that the vasculature structure identified in the tissue on the explanted array is likely of pial origin.

