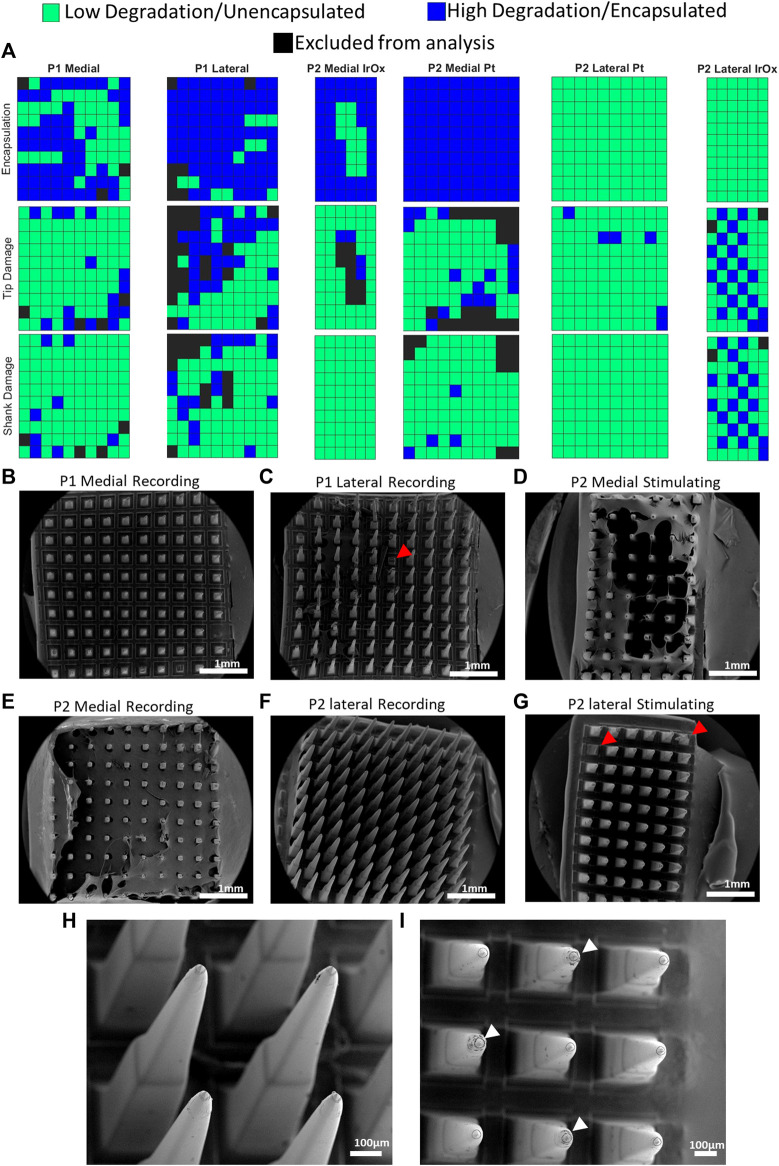
FIGURE 6.
Categories assigned to each electrode site. (A) Each site was assigned a category with respect to their material integrity or degree of encapsulation. Black sites were not able to be categorized and were excluded from the analysis. Encapsulation was determined by examining the optical images of the arrays for P1 and SEM images for P2. This is due to the enzymatic digestion of the encapsulating tissues that was performed prior to SEM imaging for P1. (B,C) Recording arrays implanted into P1 after enzymatic treatment. (D) Medial stimulating array implanted into P2. (E,F) Medial and lateral recording arrays implanted into P2. (G) Lateral stimulating array implanted into P2. (H,I) Higher magnification images of recording array in (F) and stimulating arrays in (G), respectively. White arrows indicate electrodes which were used for stimulation. Red arrows indicate representative electrodes which were excluded from analysis.

