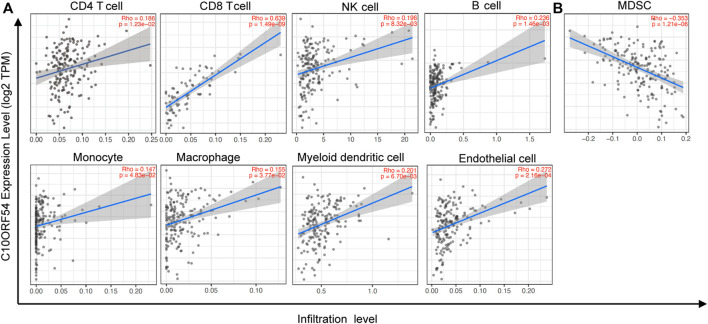
FIGURE 3.
The relationships of PD-1H expression with immune cell infiltration were assessed in ESCC based on TCGA database. The CIBERSORT algorithm was used to identify the immune cell infiltration signatures. (A) Positive correlations of PD-1H with CD4+ T cells (Rho = 0.186, p = 0.012), CD8+ T cells (Rho = 0.639, p < 0.001), CD68+ macrophages (Rho = 0.155, p = 0.038), CD1c+ myeloid dendritic cells (Rho = 0.201, p = 0.007), CD14+ monocytes (Rho = 0.147, p = 0.048), CD56+ NK cells (Rho = 0.196, p = 0.008), CD20+ B cells (Rho = 0.236, p = 0.001), and CD31+ endothelial cells (Rho = 0.272, p < 0.001). (B) The negative correlation of PD-1H with CD11b+CD33+HLA-DR−MDSCs (Rho = −0.353, p < 0.001). CIBERSORT: Cell type Identification By Estimating Relative Subsets Of RNA Transcripts.

