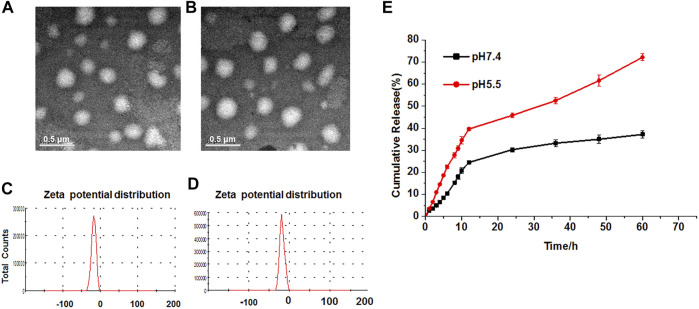
FIGURE 1.
Characterization and in vitro drug release of TPGS-Res-SLNs. TEM image (scale bar: 500 nm) of (A) Res-SLNs and (B) TPGS-Res-SLNs in the suspension. The Zeta potentials of (C) Res-SLNs and (D) TPGS-Res-SLNs. (E) In vitro release profiles of Resveratrol from TPGS-Res-SLNs at different pH (pH 7.4 and pH 5.5). Data are expressed as the mean ± S.D. (n = 3).

