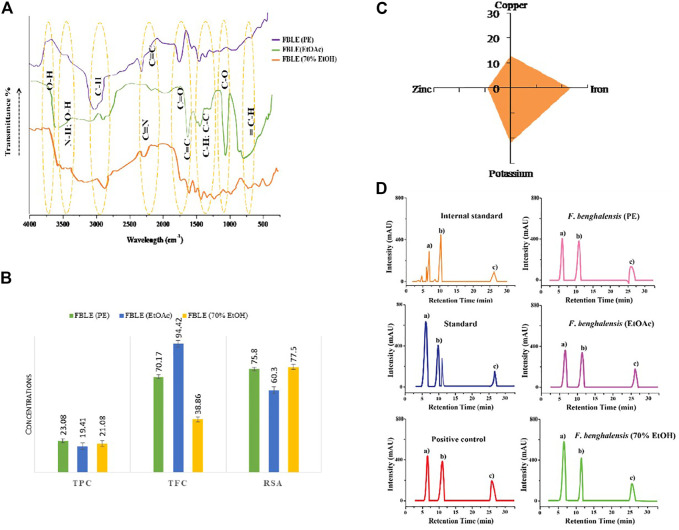
FIGURE 5.
Characterization of FBLEs and RP-HPLC analysis. In (A), FTIR fingerprints show the functional groups; (B) presence of essential minerals in dried leaves; (C) depicts antioxidants present in FBLEs. Values are mean ± SD. (D) demonstrates how much FBLEs are active in limiting SRD5AII activity. The peak (B) in RP-HPLC graphs indicates the availability of testosterone in RMs; the same peak is represented by (A) in the graph labeled as “IS”.

