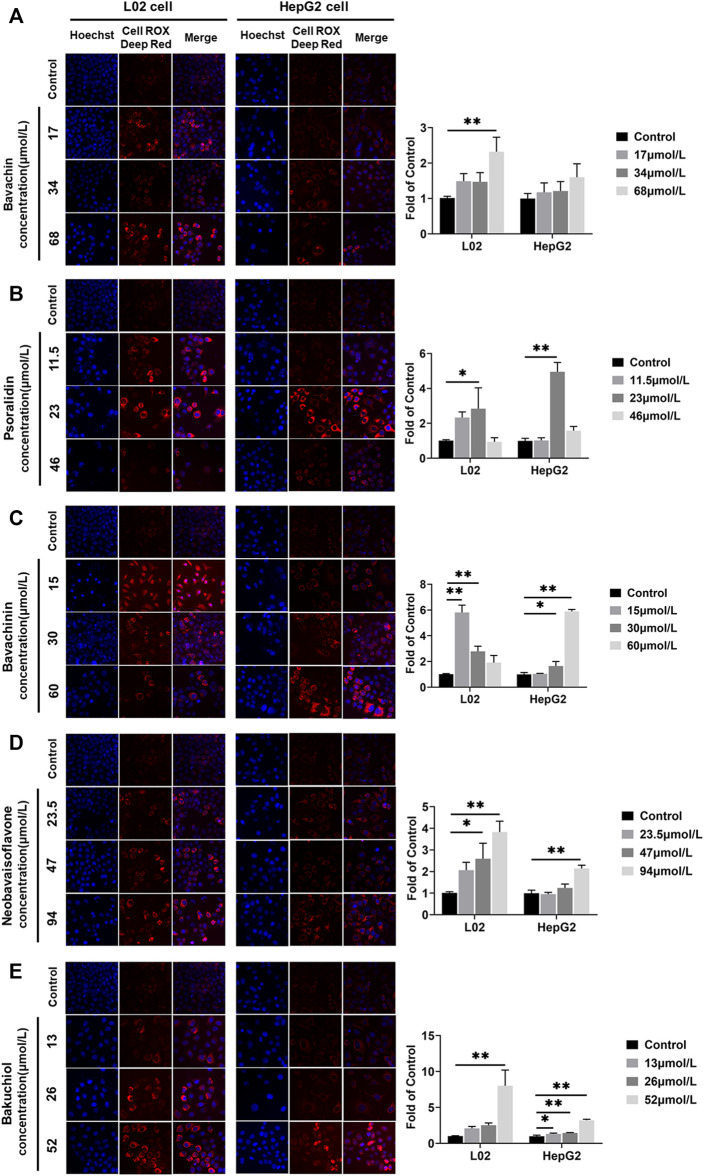
FIGURE 9.
ROS was examined and quantified using the CellROX Deep Red Reagent staining assays after the five compounds were exposed in L02 and HepG2 cells. (A) Bavachin; (B) psoralidin; (C) bavachinin; (D) neobavaisoflavone; (E) bakuchiol. Values are presented as mean ± SD, n = 3. * p < 0.05, ** p < 0.01 versus the control group. ROS, reactive oxygen species.

