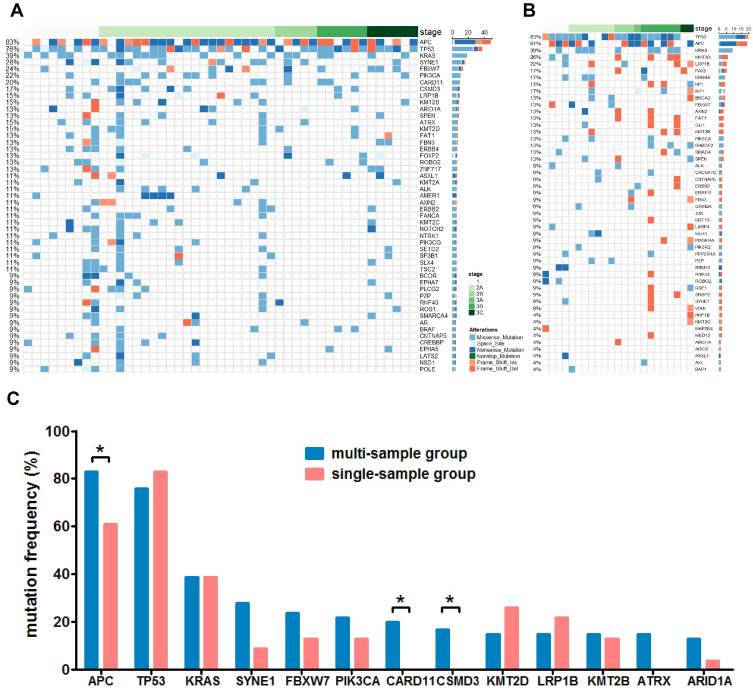
Figure 1.
The mutational status of multi-sample group and single-sample group. Panel (A) the mutational status of the top 50 mutated genes of the multi-sample group. Genes with mutations from all samples are shown. Panel (B) the mutational status of the top 50 mutated genes of the single-sample group. Panel (C) a comparison of the mutation frequency of main driver genes between the multi- and the single-sample group. *P<0.05.

