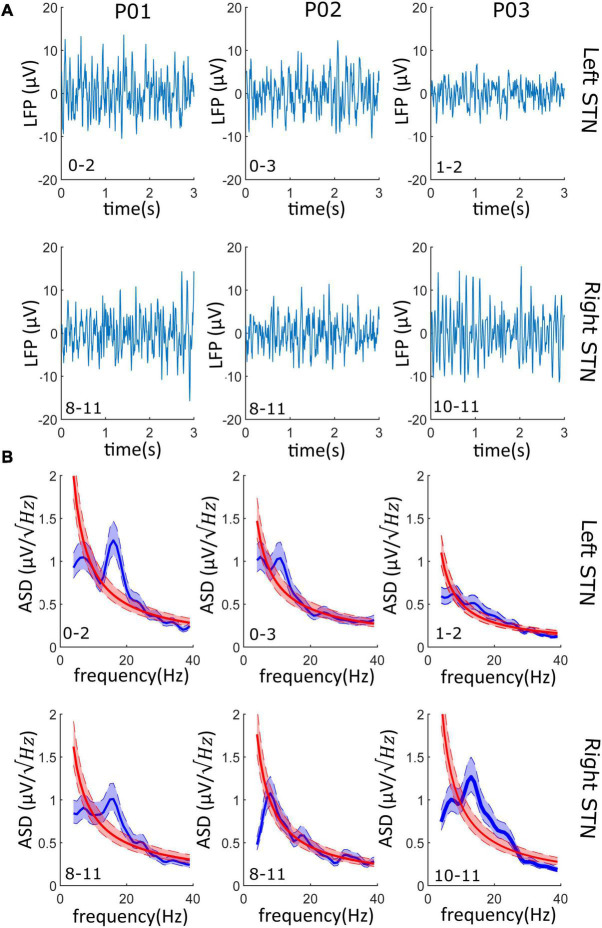
FIGURE 3.
LFPs from the streaming mode: (A) Left and right LFPs time series. 3–s LFPs recordings are shown for both the left and right STN of each patient; on the bottom left corner, the contact pair used for recording is reported (i.e., “0–2” and “8–11”). (B) The PSD of the LFPs recordings of panel (a) is shown (blue line) and superimposed to the PSD of the 1/f background noise (red line). 95% confidence interval is shadowed around the PSD average (lighter blue and lighter red overlapped band). In at least one side per patient (four of the six recordings), the beta oscillations have a significative higher power than the background neural noise.

