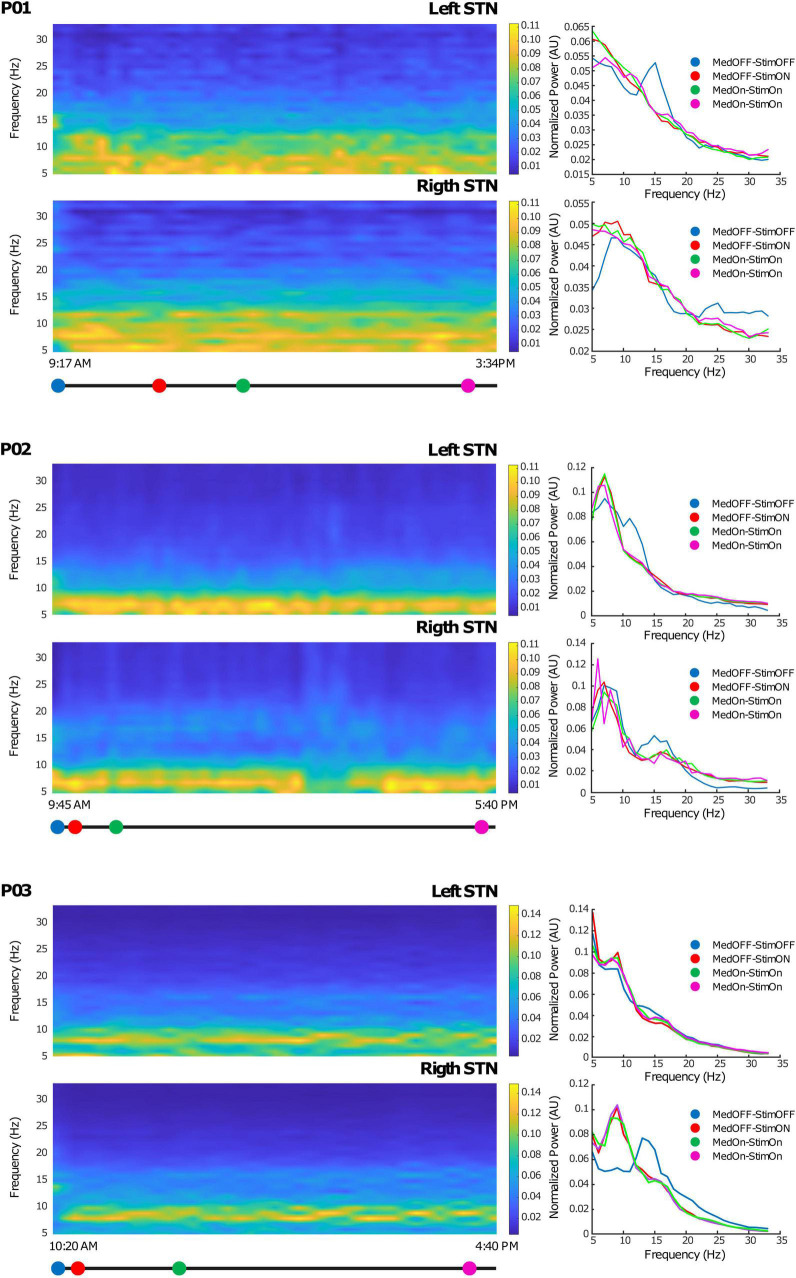
FIGURE 4.
Chronic LFP recordings in the embedded mode: Left side: Time-frequency plots of six representative hours. The x-axis represents time and the y-axis frequency (from 5 to 35 Hz). The colored dots (blue, red, green, and magenta) correspond to clinical evaluations at MedOFF/StimOFF, MedOFF/StimON, MedON/StimON, and MedON/StimON, respectively. Right side: Amplitude spectrum of the LFPs of both the left and right STN extracted as the mean of the ± 10-min interval around the evaluation point (MedOFF/StimOFF, MedOFF/StimON, MedON/StimON, and MedON/StimON) obtained at the time indicated in the left side panels. Please note that, in MedOFF-StimOFF, a clear beta peak is present in the left STN of patients 01 and 02 and the right STN of patient 03. This beta peak was disappeared by the stimulation.

