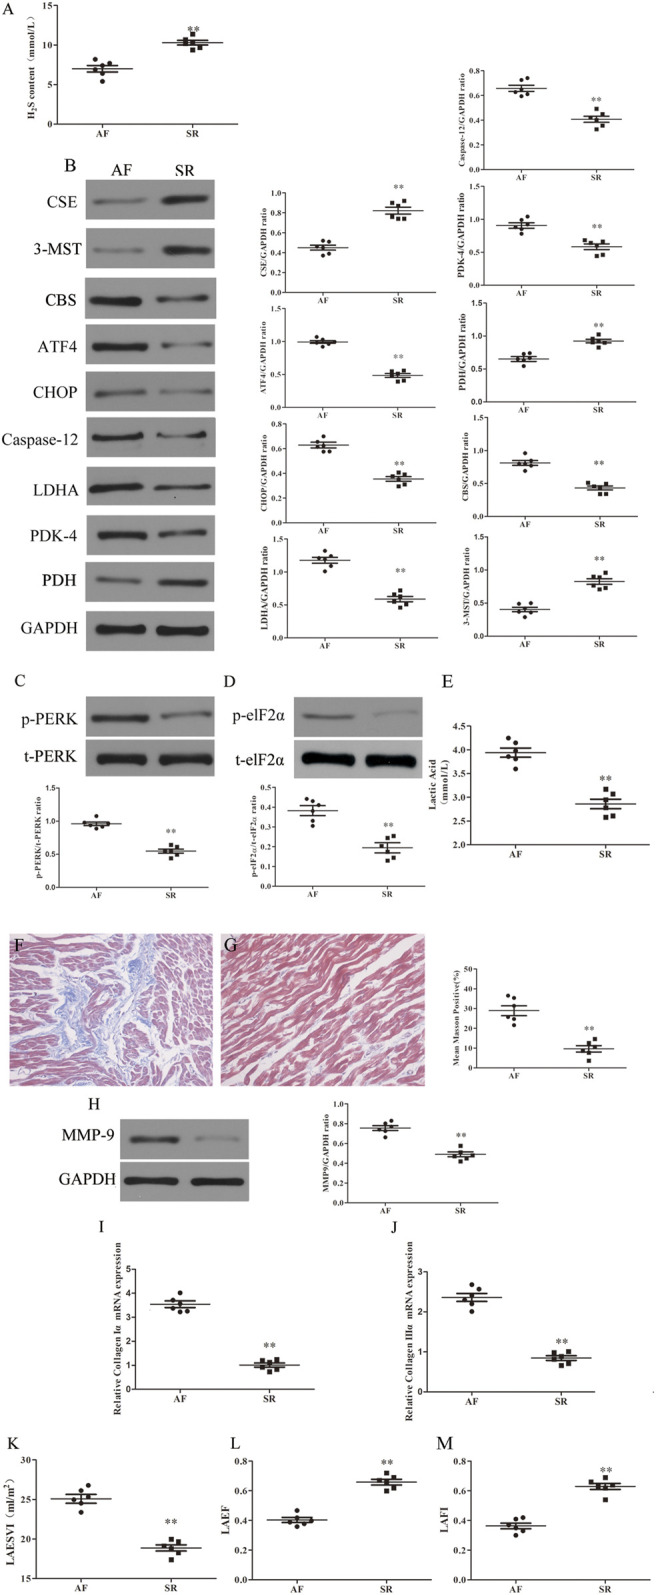
FIGURE 1.

Increased fibrosis, ERS and Warburg effect and decreased CSE expression and left atrial function were found in AF patients compared with SR patients. (A) H2S content was determined by Methylene blue method in the LAA of patients with SR or AF (n = 6 in each group). (B) Representative Western blotting and relative densitometry analysis of CSE, CBS, 3-MST, PDK-4, LDHA, PDH, ATF-4, CHOP, caspase-12 and GAPDH in the LAA of patients with SR or AF (n = 6 in each group). (C) Western blotting was used to analyze the protein levels of p-PERK and t-PERK in the LAA of patients with SR or AF (n = 6 in each group). (D) Western blotting was used to analyze the protein levels of p-elf2α and t-elf2α in the LAA of patients with SR or AF (n = 6 in each group). (E) Lactate acid was determined by kit analysis in the LAA of patients with SR or AF (n = 6 in each group). Blue staining with representative Masson staining (scale bar = 50 μm) and quantification of atrial fibrosis (n = 6 in each group, with ≥40 fields in each group) were used in the (F) AF group and (G) SR group. (H) Western blotting was used to analyze the protein levels of MMP-9 and GAPDH in the LAA of patients with SR or AF (n = 6 in each group). Representative RT-PCR and relative densitometry analysis of (I) collagen Iα and (J) collagen IIIα in the LAA of patients with SR or AF (n = 6 in each group). Left atrial function was measured by color Doppler echocardiography (K) LAESVI, (L) LAEF and (M) LAFI (n = 6 in each group) in the patients with SR or AF during the echocardiographic studies. **p < 0.01 VS AF. A Student’s t-test was used for each of these comparisons between AF and SR groups.
