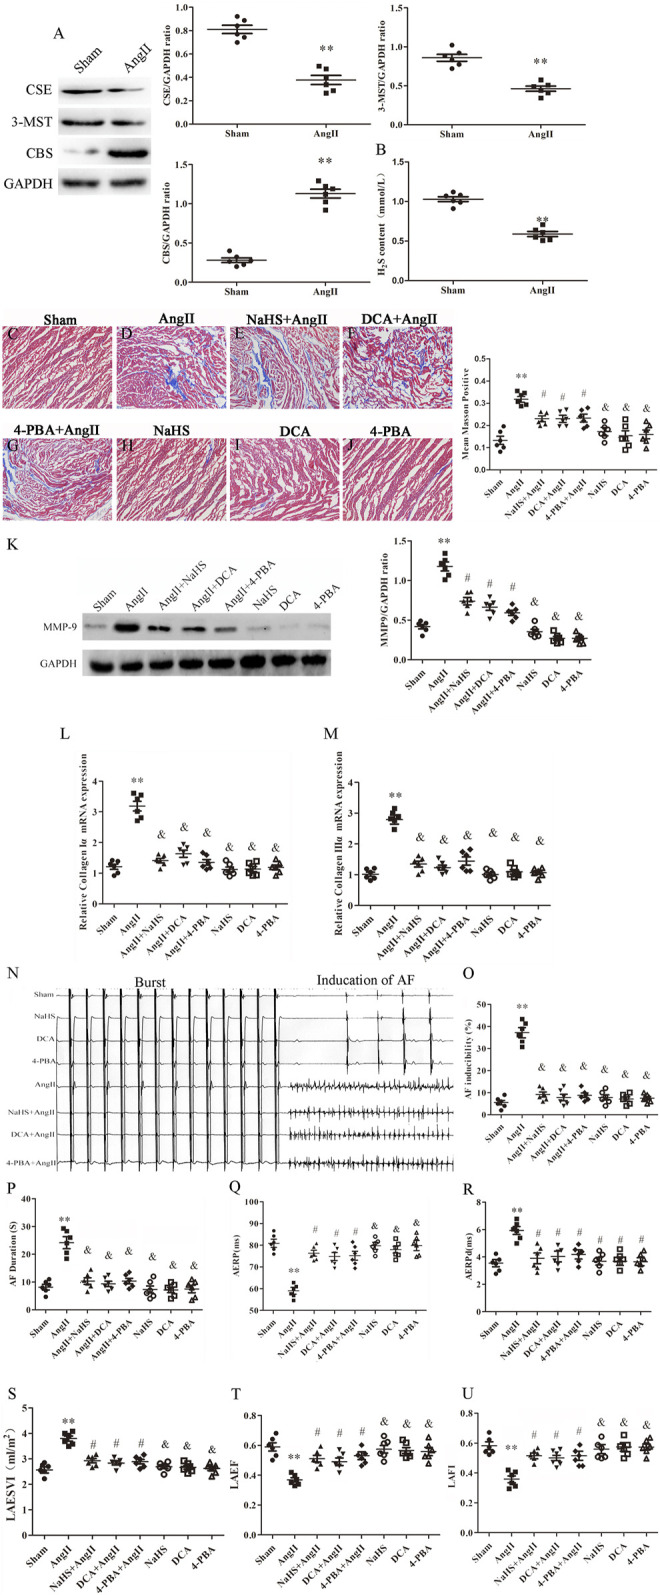
FIGURE 4.

NaHS inhibits left atrial remodeling induced by Ang II in SD rats and is associated with the inhibition of the Warburg effect and ERS. (A) Representative Western blotting and relative densitometry analysis of CSE, 3-MST and CBS with GAPDH as the loading control in the rats left atrial tissue of the indicated groups. (n = 6 in each group). (B) H2S content was determined by Methylene blue method in the rats plasma of the indicated groups (n = 6 in each group). Blue staining with representative Masson staining (scale bar = 50 μm) and quantification of atrial fibrosis (n = 6 in each group, with ≥40 fields in each group) were used in the (C) Sham group, (D) Ang II group, (E) NaHS + Ang II group, (F) DCA + Ang II group, (G) 4-PBA + Ang II group, (H) NaHS group, (I) DCA group and (J) 4-PBA group. (K) Representative Western blotting and relative densitometry analysis of MMP-9 with GAPDH as the loading control in the rats left atrial tissue of the indicated groups (n = 6 in each group). Representative RT-PCR and relative densitometry analysis of (L) Collagen Iα and (M) Collagen IIIαin the rats left atrial tissue of the indicated groups (n = 6 in each group). (N) ARPS was performed via the esophagus, and AF episodes and duration were recorded in the rats indicated groups. Electrophysiological analysis of numbers of AF episodes (O) and durations of AF (P), AERP (Q) and AERPd (R) in the rats indicated groups during the electrophysiological studies (n = 6 in each group). Left atrial function was measured by color Doppler echocardiography (S) LAESVI, (T) LAEF, and (U) LAFI in the rats indicated groups during the echocardiographic studies (n = 6 in each group). **p < 0.01 VS Control, and p < 0.01 VS Ang II, #p < 0.05 VS Ang II. Groups were compared using one-way analysis of variance (ANOVA) (Tukey’s) in C to M and P to U, Fisher’s exact test was used to compare groups in O, and Student’s t-test was used to compare groups in (A,B).
