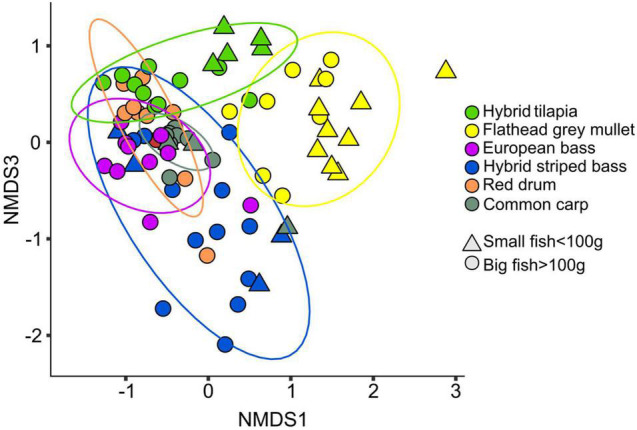
FIGURE 1.

NMDS (Bray–Curtis dissimilarity) plot for the intestinal microbiota composition (stress value <0.2, K = 3) of small (<100 g) and big (>100 g) fish from the six different species. Significant differences were found between the microbiota composition of the different fish species (Table 1 and Supplementary Table 3).
