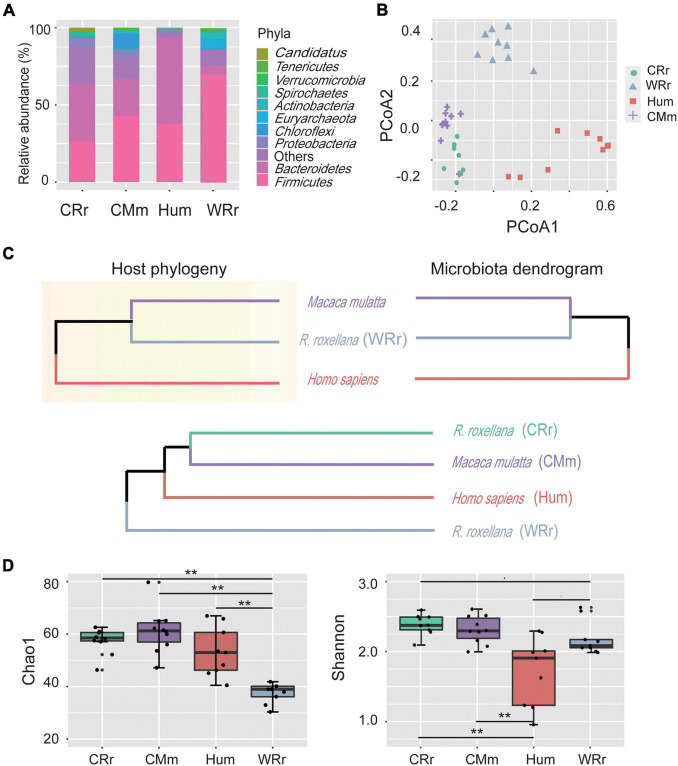
FIGURE 1.
Community constituents, structure, richness, and diversity of the gut microbiome among all cohorts. (A) Compositional bar plot of the ten most abundant phyla in each cohort (WRr: wild R. roxellana; CRr: captive R. roxellana; Hum: humans; CMm: captive M. mulatta). (B) PCoA plot of the gut microbiome community composition in the four cohorts at the genus level. (C) Comparison of the host phylogeny (upper left panel; assembled using http://timetree.org/) and their hierarchical tree (upper right panel). The gut microbiome dendrogram of the four cohorts (lower panel). (D) Alpha diversity of the gut microbiome in the four cohorts and [p(FDR)-value] between cohorts. Two asterisk indicates significant differences (p(FDR)-value < 0.01). Panel (A–D) indicate the tremendous effects of captivity and lifestyle on captive monkeys, and the gut microbiome of captive monkeys was more similar to that of humans than to that of wild monkeys.

