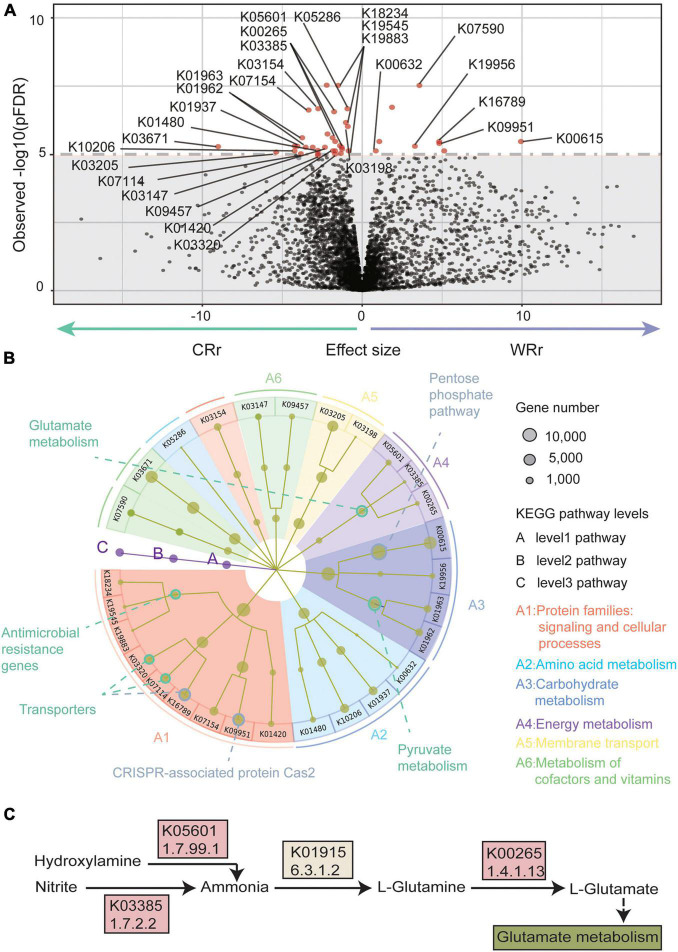
FIGURE 3.
Metagenome-wide association study results of the wild-captive R. roxellana gene association test. (A) A volcano plot of the K-numbers based on the KEGG database. In the volcano plot, the x-axis indicates beta value of the GLM as the effect size. The y-axis indicates observed –log10 [p(FDR)-values]. The horizontal dotted line indicates p(FDR) = 1e-5. There were 40 K-numbers with p(FDR) < 1e-5 are plotted as red dots, and other clades are plotted as black dots. (B) System diagram of KEGG pathways enriched with the 40 K-numbers highlighted in (A). The three levels are defined as A, B, and C and described from the inner layer out. The size of the dots represents the number of genes. The eight pathways with significant enrichment are outlined by circles (green: pathways with significantly different abundance in CRr samples; gray: pathways with significantly different abundance in WRr samples). (C) A pathway diagram showing the K-numbers associated with glutamate metabolism. Panel (A–C) show the significantly differentially abundant pathways between captive and wild R. roxellana and the abundance K-numbers associated with L-glutamate in the captive population.

