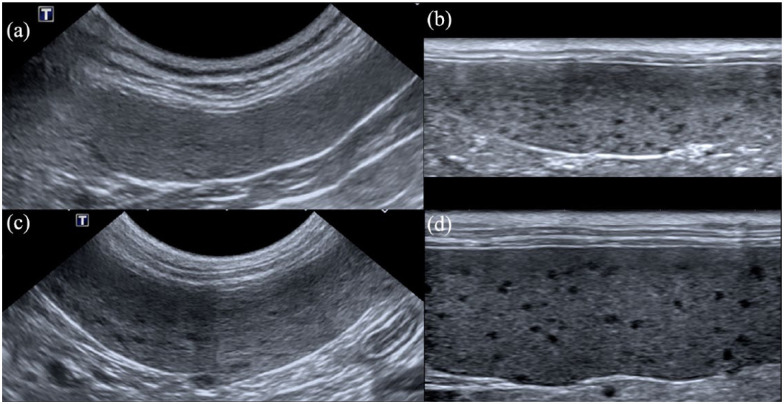
Figure 2.
Examples of ultrasonographic (US) images of a honeycomb appearance of the spleen. US examination of the spleen was performed with (a,c) a micro-convex 8 MHz probe and with (b,d) a linear 18 MHz probe. Images (a) and (b) are from a cat with extramedullary haematopoiesis; the honeycomb pattern is not clearly visible with the lower-frequency probe (a). Images (c) and (d) are from a cat with lymphomatous infiltration of the spleen. The honeycomb pattern is visible with (c) the micro-convex probe and more clearly depicted with (d) the linear probe

