11.

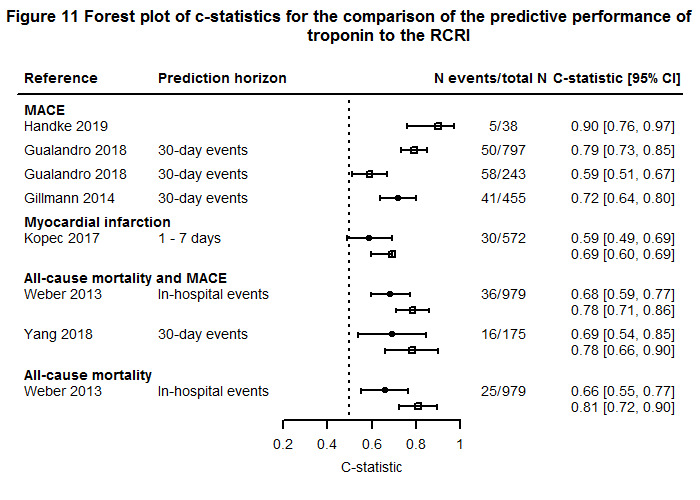
Per article, two c‐statistics with confidence intervals are presented. The upper (filled circle) represents the RCRI alone and the lower (open square) represents troponin alone. As Handke 2019 and Gualandro 2018 solely reported on the c‐statistics for the additive model, no c‐statistic for RCRI alone is provided for this study. Gillmann 2014 only reported c‐statistics for RCRI alone.
