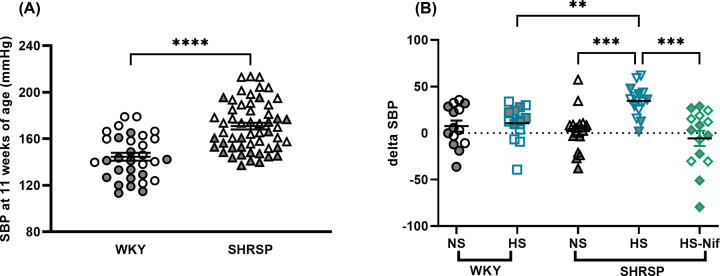
Figure 1. Salt-loading increases BP in SHRSP.
SBP was assessed by tail-cuff measurements. Each single dot represents an average of six to ten consecutive weekly SBP recordings. (A) shows the difference in SBP between 11-week-old WKY (n=32) and SHRSP (n=54). ****P<0.0001 (Welch’s t test). Sexual dimorphism in SBP was observed in SHRSP (female shaded gray). (B) shows differences in SBP (ΔSBP) between baseline (11-week-old) and after 3 weeks of salt loading. WKY were divided into two groups (n=16/group): normal salt (NS; no salt drinking water) and high salt (HS; 1% NaCl in drinking water). SHRSP were divided into three groups (n=16/group): NS, HS and high salt with nifedipine (HS-Nif). Nifedipine prevented the salt-induced increase in SBP in salt loaded SHRSP. **P<0.01, ***P<0.001 (Brown–Forsythe Welch ANOVA test). Symbols with gray fill indicate female. Bars indicate mean ± s.e.m.

