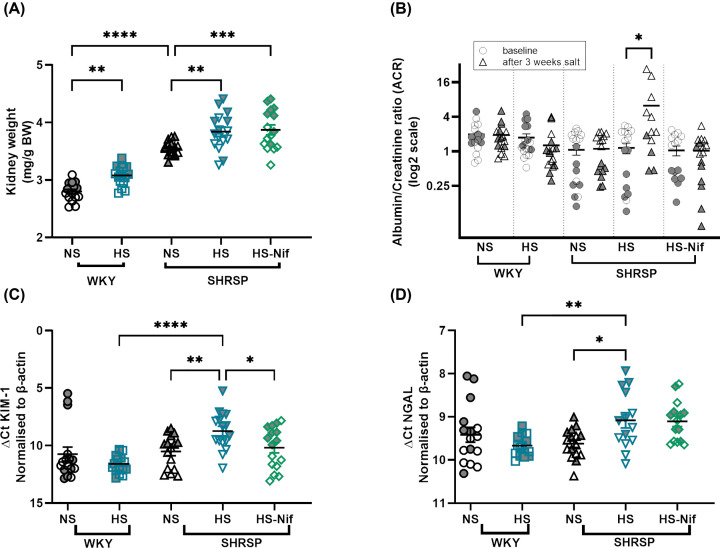
Figure 2. Salt-loading induced kidney injury markers in SHRSP.
(A) shows the significant difference in kidney weight among strains. Salt-loading significantly increased the kidney weight. **P<0.01, ***P<0.001, ****P<0.0001 (ANOVA with Bonferroni’s multiple comparison test). (B) shows the significant difference in ACR in SHRSP after salt-loading which is ameliorated with nifedipine treatment. *P<0.05 (Student’s t test). (C,D) represent mRNA expression of kidney injury marker-1 (KIM-1) and neutrophil gelatinase-associated lipocalin (NGAL), respectively. *P<0.05, **P<0.01, ****P<0.0001 (Brown–Forsythe Welch ANOVA test). NS: normal salt, HS: high salt (1% NaCl) and HS-Nif: high salt with nifedipine, n=16 per group. Symbols with gray fill indicate female. Bars indicate mean ± s.e.m.

