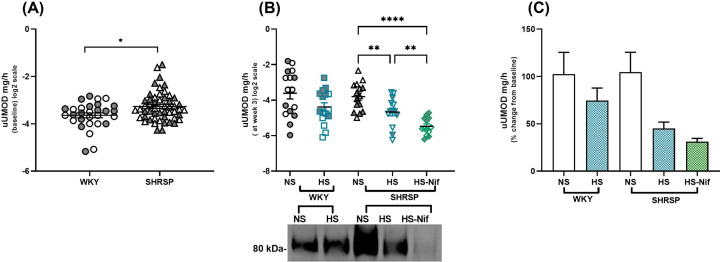
Figure 3. Urinary UMOD decreases with salt-loading in both WKY and SHRSP.
Twenty-four hour urine samples were collected from rats caged individually once a week in metabolic cages. Urinary UMOD (uUMOD) concentration in urine samples were quantified by ELISA and normalised to 24-h urine output. (A) represents the difference in baseline (11-week-old rats) 24-h uUMOD between WKY (n=32) and SHRSP (n=54). *P<0.05 (Mann–Whitney test). Salt loading decreased uUMOD excretion in urine in both strains, and nifedipine treatment did not change the salt-induced reduction of uUMOD. (B) compares the 24-h uUMOD (ELISA) between groups at week 3 of salt-loading. Western blot represents pool of samples from each group. **P<0.01, ****P<0.0001 (Brown–Forsythe Welch ANOVA test). (C) represents the percentage change of uUMOD from baseline after 3 weeks of salt-loading in each group. Bars indicate mean ± s.e.m; NS: normal salt, HS: high salt (1% NaCl) and HS-Nif: high salt with nifedipine, n=16 per group. Symbols with gray fill indicate female.

