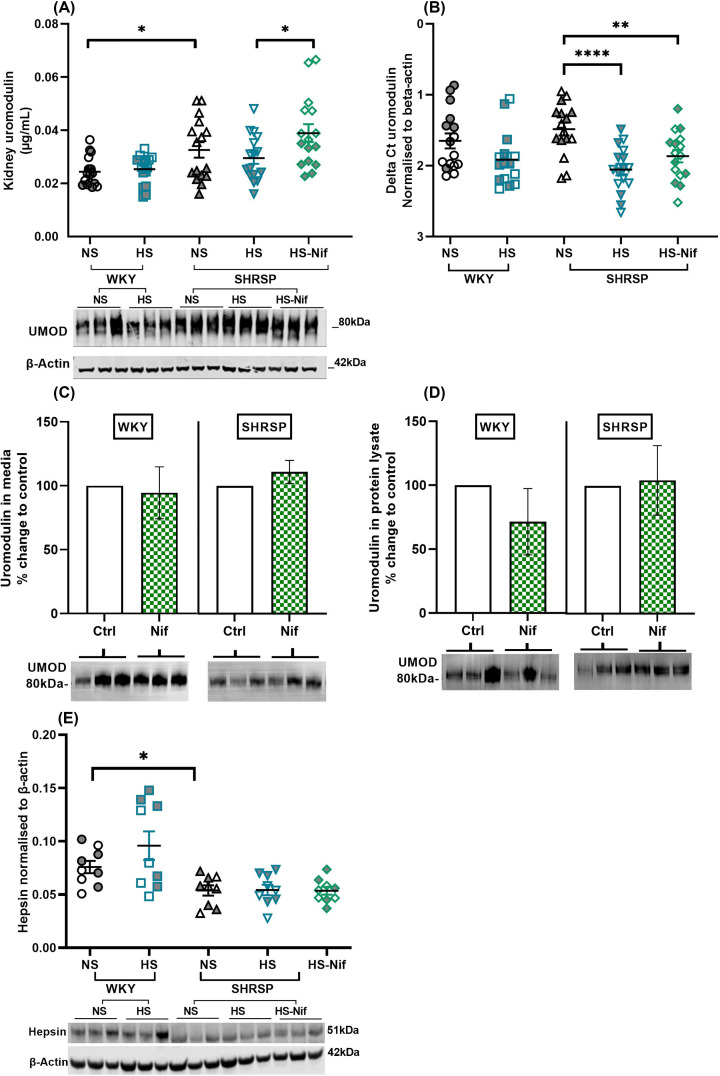
Figure 4. uUMOD excretion does not reflect its mRNA and total kidney protein level.
One-fourth of kidney (cut into sagittal plane and then into two halves) was used for RNA and total protein isolation (n=16 per group). (A) shows the significant difference in total kidney UMOD between strains and no significant difference with salt loading. Top: Graph represents results of UMOD ELISA normalised to total protein; Bottom: representative Western blot image of each group. (B) represents the comparison of δCt of Umod normalised to β-actin within strains. (C,D) represents the ex-vivo experiment, wherein, medullary tubules were isolated from kidneys of WKY and SHRSP (12 ± 3 weeks old). The tubules were incubated either with 10 mM nifedipine (Nif) for 6 h at 37°C. The results are representation of two experiments performed each with WKY (n=4) and SHRSP (n=6) rats. (C) shows no significant change in UMOD secretion in media from both WKY and SHRSP tubules when incubated with nifedipine. (D) shows no change in UMOD in tubule protein lysate in both strains after incubation with nifedipine. Western blots at the bottom of panels (A,B) are representative images. Ctrl = control. Full image of Western blot and analysis can be found in Supplementary Figure S8. (E) shows the strains (n=9 per group) significant difference in hepsin expression in kidney, which is unaffected with salt. Western blot is representative image of each group. *P<0.05, **P<0.01, ****P<0.0001 (Brown–Forsythe Welch ANOVA test). Bars indicate mean ± s.e.m. NS: normal salt, HS: high salt (1% NaCl) and HS-Nif: high salt with nifedipine. Symbols with gray fill indicate female.

